Open Access
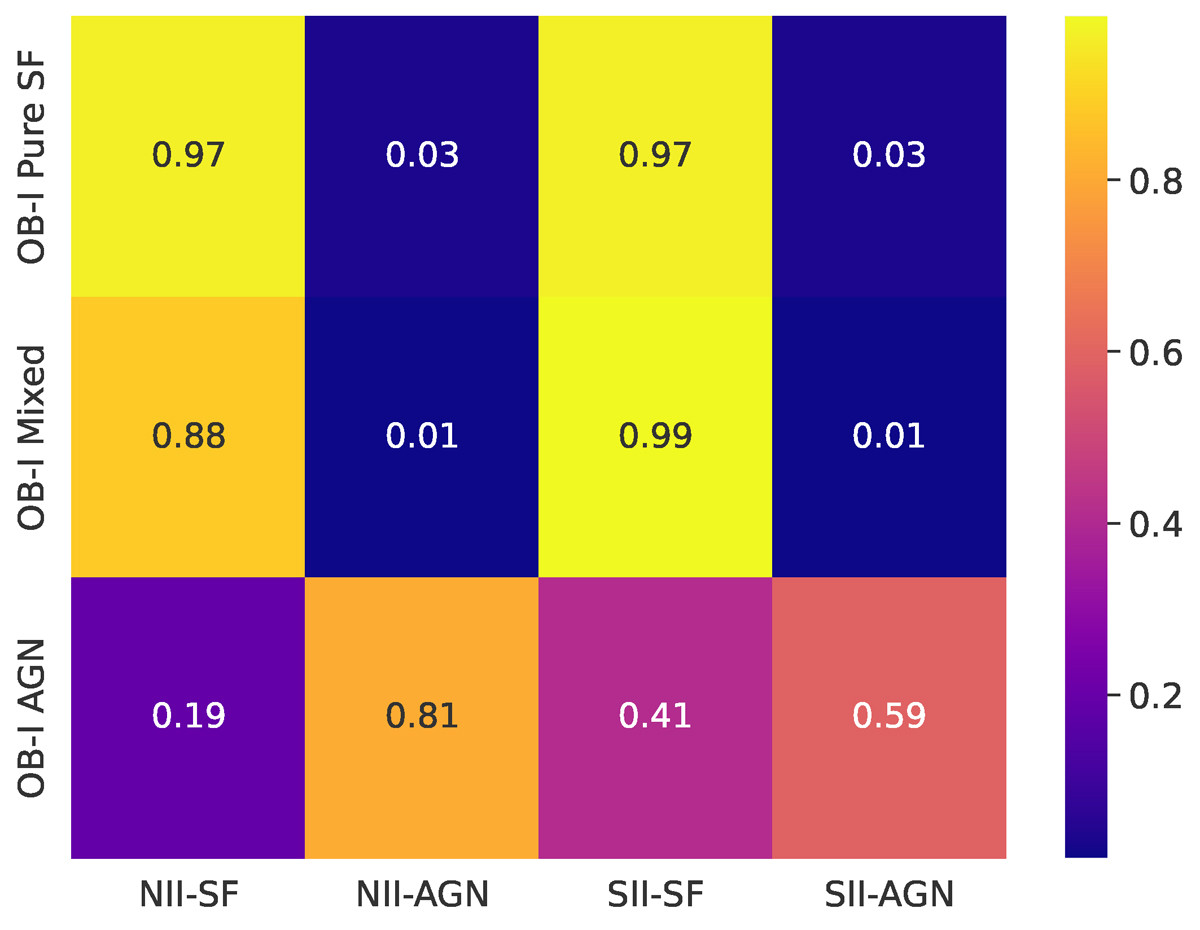
Fig. 11.
Download original image
Match between the OB-I classes and the NII and SII diagram regions. This tells us how many galaxies in the OB-I classification belongs to the NII or SII classes; for example, the top left square shows that 97% of OB-I pure SF are in the SF region of the NII diagram.
Current usage metrics show cumulative count of Article Views (full-text article views including HTML views, PDF and ePub downloads, according to the available data) and Abstracts Views on Vision4Press platform.
Data correspond to usage on the plateform after 2015. The current usage metrics is available 48-96 hours after online publication and is updated daily on week days.
Initial download of the metrics may take a while.