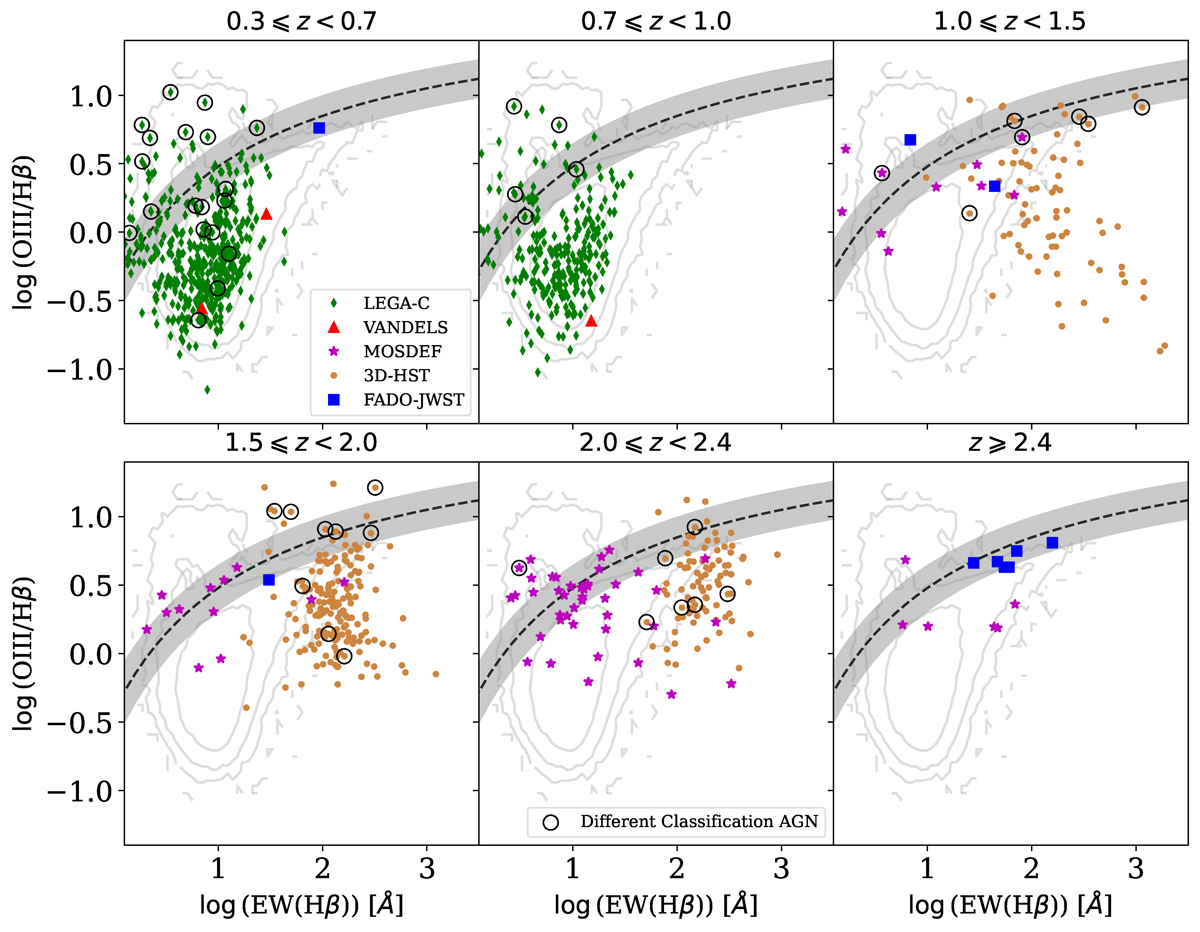
Fig. 12.
Download original image
OB-I diagram of the higher-redshift sample. The green diamonds represent the LEGA-C sample, the red triangles the VANDELS sample, the orange circles the 3D-HST sample, the magenta stars the MOSDEF sample, and the blue squares the FADO-JWST sample. The encircled symbols represent galaxies that are classified as AGNs by a separate classification scheme (see Appendix A). The grey contours represent the FADO-SDSS sample. The black dashed line is the separation line we defined in Eq. (2). The defined redshift bin is shown above each panel.
Current usage metrics show cumulative count of Article Views (full-text article views including HTML views, PDF and ePub downloads, according to the available data) and Abstracts Views on Vision4Press platform.
Data correspond to usage on the plateform after 2015. The current usage metrics is available 48-96 hours after online publication and is updated daily on week days.
Initial download of the metrics may take a while.