Fig. A.2.
Download original image
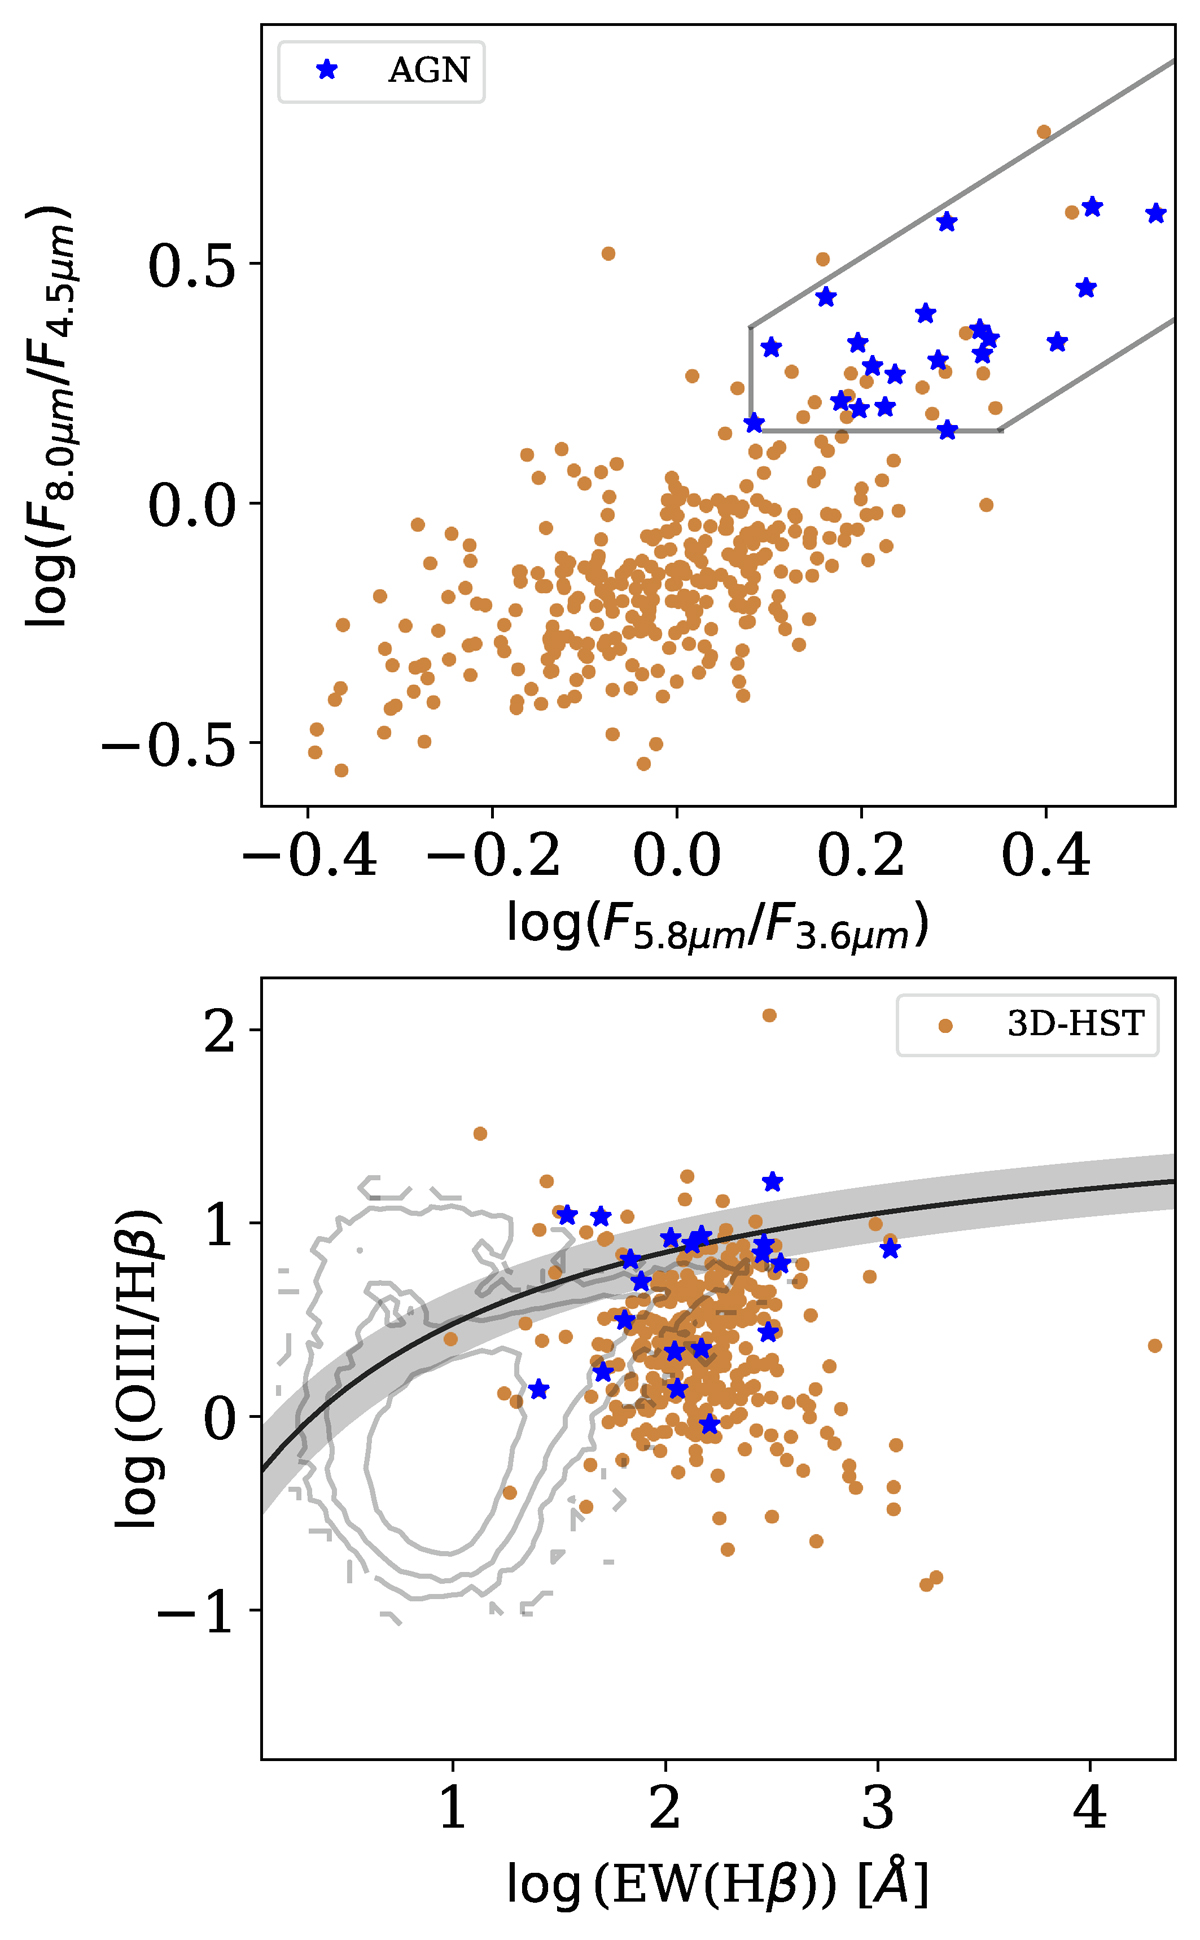
3D-HST sample in an IRAC colour-colour plot (top) and the OB-I diagram (bottom). In the top panel, the black lines represent the area according to Eq. (A.1) that was used to identify AGNs (blue stars). All the remaining galaxies should be SF and are represented by orange dots. In the bottom panel stars and dots are the same as in the IRAC colour-colour plot. The grey contours represent the FADO-SDSS sample and the black line and grey shaded area represent our empirical separation given by Eq. (2).
Current usage metrics show cumulative count of Article Views (full-text article views including HTML views, PDF and ePub downloads, according to the available data) and Abstracts Views on Vision4Press platform.
Data correspond to usage on the plateform after 2015. The current usage metrics is available 48-96 hours after online publication and is updated daily on week days.
Initial download of the metrics may take a while.