Fig. 2.
Download original image
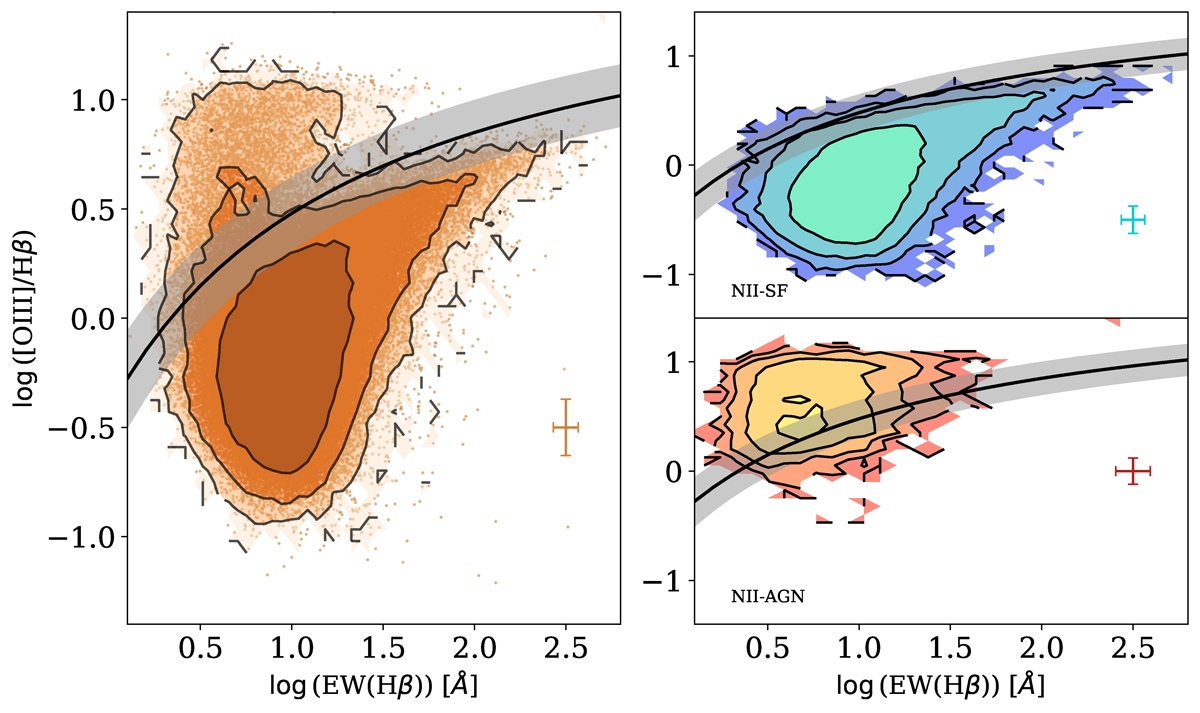
OB-I diagram, with our empirical separation line. On all plots, the black curve and the grey shaded region represent our empirical separation line (see Eq. (2)). Left: FADO-SDSS sample (orange dots), as described in Sect. 2.1. The error bar represents the median error for all the points. Each contour represents 25% more of the sample, from the smallest to the largest. Right: NII-SF galaxies (top) and NII-AGN galaxies (bottom) that we used to define the empirical line.
Current usage metrics show cumulative count of Article Views (full-text article views including HTML views, PDF and ePub downloads, according to the available data) and Abstracts Views on Vision4Press platform.
Data correspond to usage on the plateform after 2015. The current usage metrics is available 48-96 hours after online publication and is updated daily on week days.
Initial download of the metrics may take a while.