Open Access
Fig. 4.
Download original image
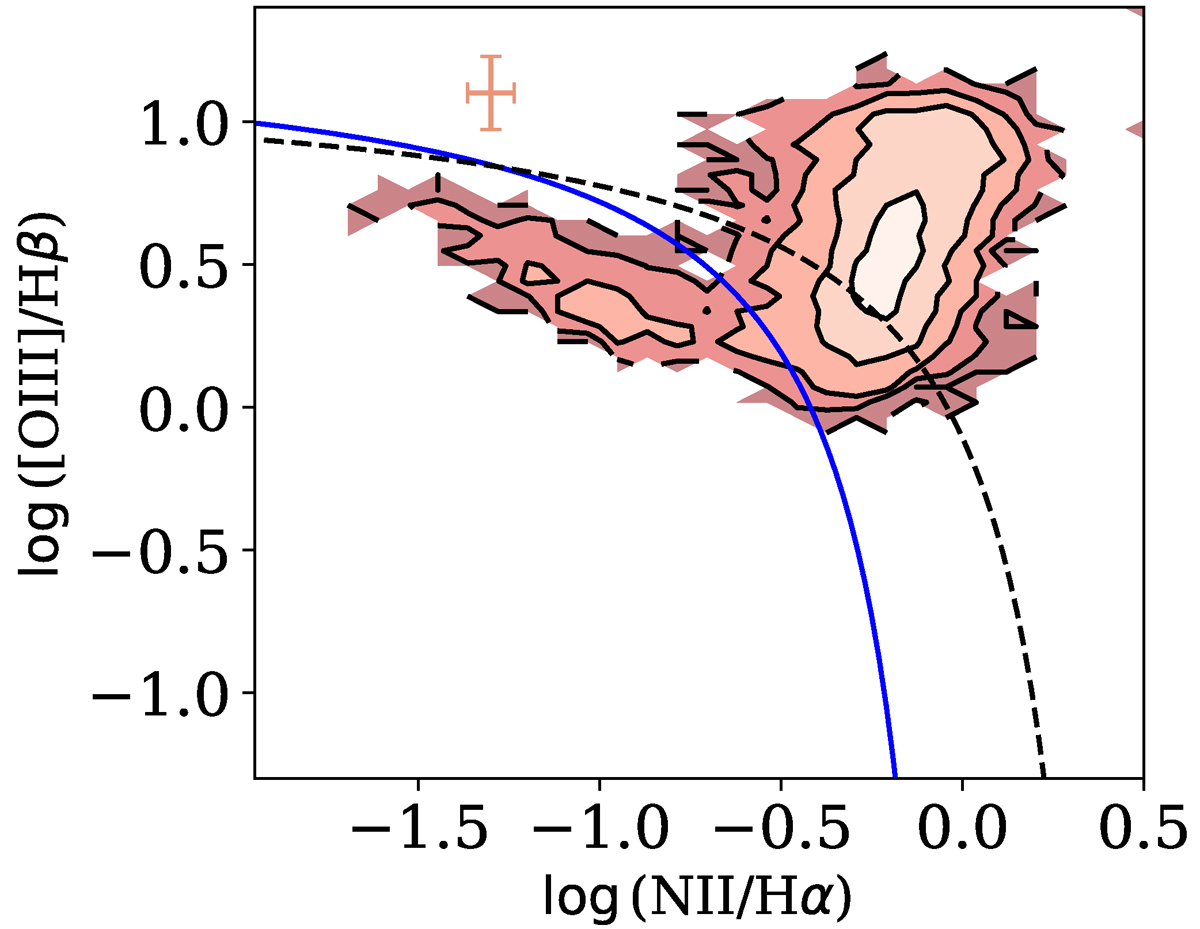
OB-I AGNs in the NII diagram. The blue line represents the Kauffmann et al. (2003) separation line, while the black dashed line represents the Kewley et al. (2001) line. All the remaining elements are the same as in Fig. 2.
Current usage metrics show cumulative count of Article Views (full-text article views including HTML views, PDF and ePub downloads, according to the available data) and Abstracts Views on Vision4Press platform.
Data correspond to usage on the plateform after 2015. The current usage metrics is available 48-96 hours after online publication and is updated daily on week days.
Initial download of the metrics may take a while.