Open Access
Fig. 12
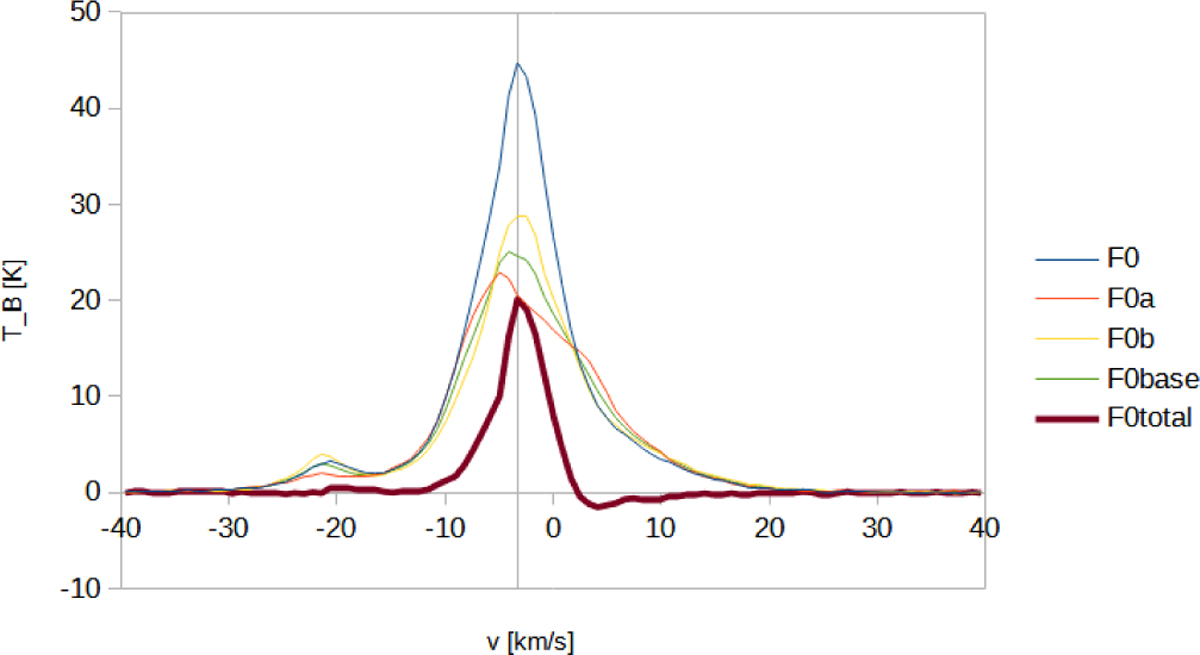
Download original image
H I 21 cm spectra in the direction of the N(H) peak F inside the Zebra1 nebula. ON (F0) and two OFF spectra (F0a and F0b are shown as well as the residual (F0total) calculated by subtracting the average of the OFF spectra (F0base) from the ON spectrum. A vertical line is drawn at vLSR = -3.3 km s-1).
Current usage metrics show cumulative count of Article Views (full-text article views including HTML views, PDF and ePub downloads, according to the available data) and Abstracts Views on Vision4Press platform.
Data correspond to usage on the plateform after 2015. The current usage metrics is available 48-96 hours after online publication and is updated daily on week days.
Initial download of the metrics may take a while.