Open Access
Fig. 7
Download original image
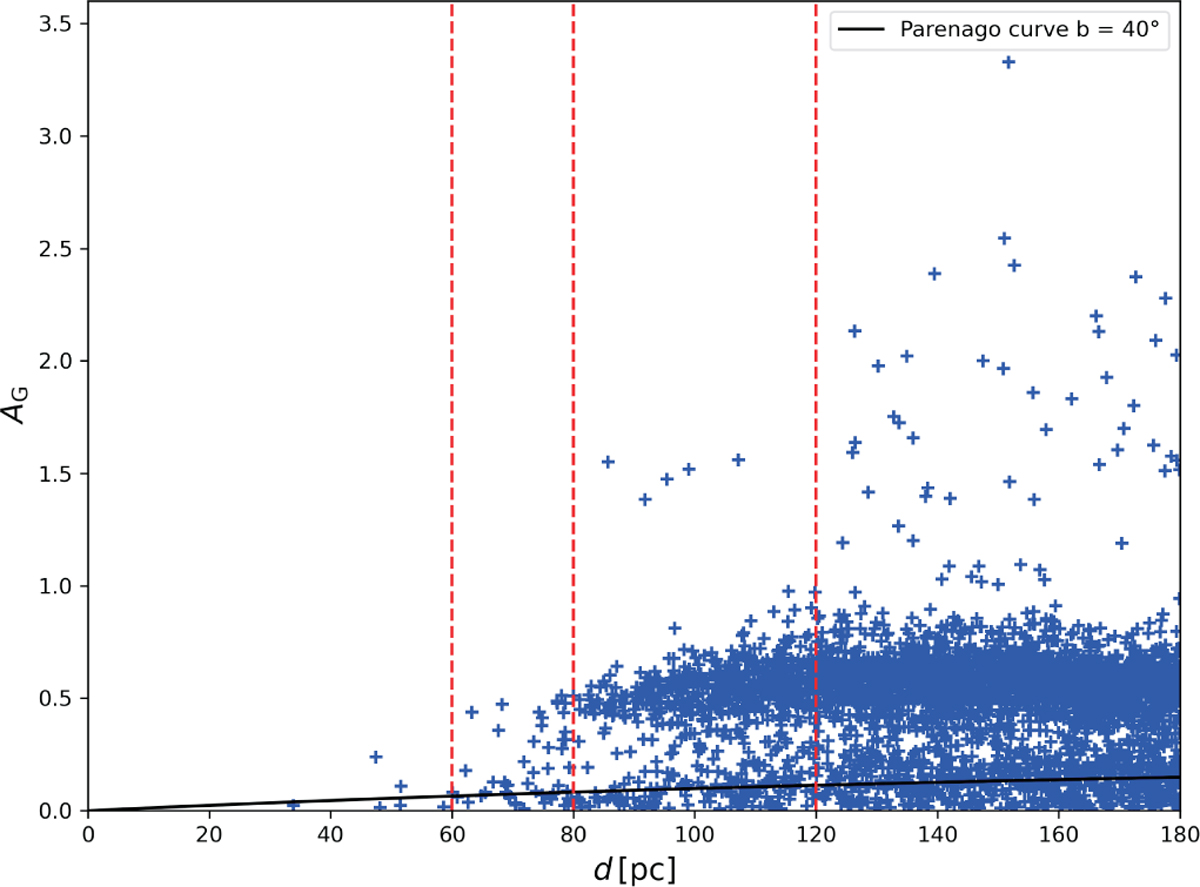
Distance vs extinction diagram based on 3822 stars in the Gaia DR3 taken from the sky window (14h06m 17s ≤ RA ≤ 15h07m 17s, -21°33′50″≤ DE ≤ -11°23′2″), as Fig. 3(A). The vertical red lines mark break points at about 60, 80, and 120 pc.
Current usage metrics show cumulative count of Article Views (full-text article views including HTML views, PDF and ePub downloads, according to the available data) and Abstracts Views on Vision4Press platform.
Data correspond to usage on the plateform after 2015. The current usage metrics is available 48-96 hours after online publication and is updated daily on week days.
Initial download of the metrics may take a while.