Open Access
Fig. A.4
Download original image
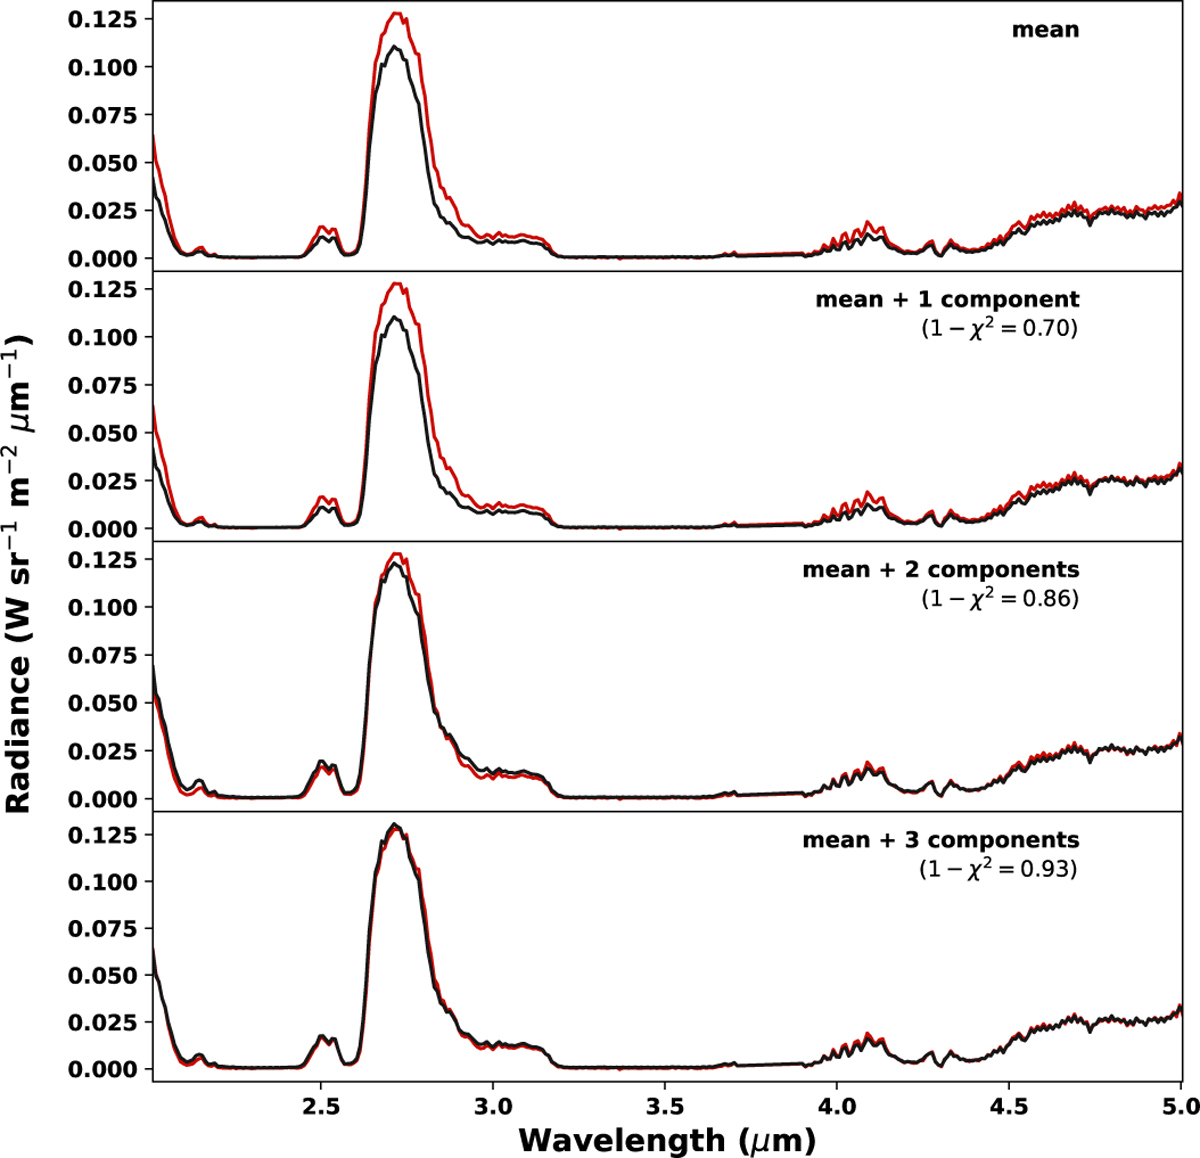
Example of the results of the PCA decomposition (black curves, at various stages), cf. Eqn. (1), applied to a random spectrum of the PJ1 G21 subset (red curve). The quality of the reconstruction after the decomposition is given by the parameter 1 −χ2, which should be close to unity.
Current usage metrics show cumulative count of Article Views (full-text article views including HTML views, PDF and ePub downloads, according to the available data) and Abstracts Views on Vision4Press platform.
Data correspond to usage on the plateform after 2015. The current usage metrics is available 48-96 hours after online publication and is updated daily on week days.
Initial download of the metrics may take a while.