Fig. 7
Download original image
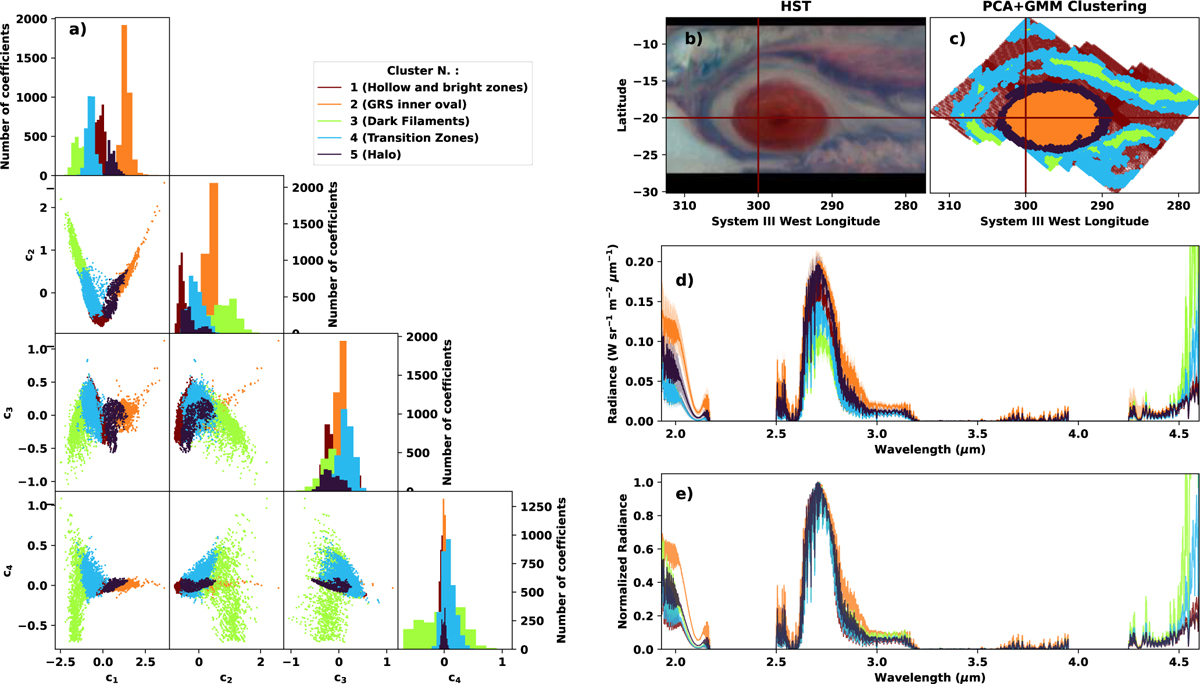
(a) Results of the chopper.py GMM analysis on the PCA-decomposition coefficients presented in Fig. 6 using a value of K=5. The resulting clusters are represented using different colors in the corner plot of the distribution of the coefficients. (b and c) Spatial maps of the resulting PCA+GMM clusters found by chopper.py compared to HST images. (d) Mean spectra of the clusters found by chopper.py. (e) Same as panel d but the spectra are normalized for the radiance measured at 2.73 µm.
Current usage metrics show cumulative count of Article Views (full-text article views including HTML views, PDF and ePub downloads, according to the available data) and Abstracts Views on Vision4Press platform.
Data correspond to usage on the plateform after 2015. The current usage metrics is available 48-96 hours after online publication and is updated daily on week days.
Initial download of the metrics may take a while.