Fig. 2.
Download original image
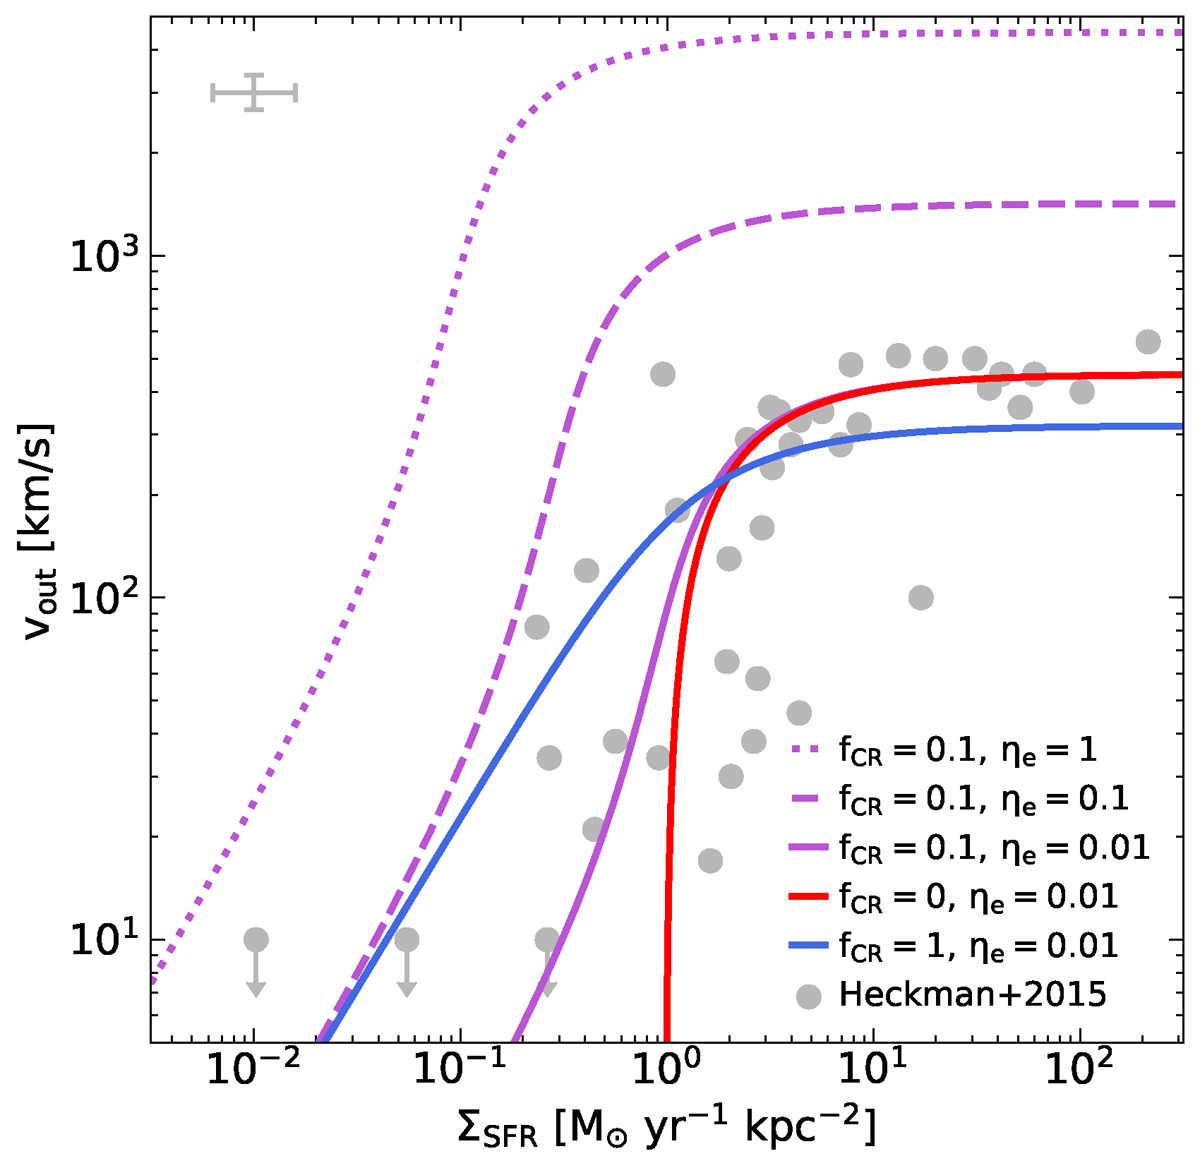
Terminal outflow velocities as a function of star formation rate surface density for different choices of CR energy fractions, fCR, and energy loading factors, ηe. The model predictions are compared with data from Heckman et al. (2015), which show measured outflow velocities for a sample of nearby starburst galaxies with stellar masses in the range log10(M*/M⊙) ∈ [7.1 − 10.9]. Typical uncertainties are indicated in the top-left corner. The model with ηe ∼ 0.01 and fCR ∼ 0.1 provides a good match with the observed data. Models with higher energy loading values (ηe) generally predict outflow velocities in excess of the observations. The transition from slow outflows in weak starbursts to fast outflows in strong starbursts is best captured by models with fCR > 0.
Current usage metrics show cumulative count of Article Views (full-text article views including HTML views, PDF and ePub downloads, according to the available data) and Abstracts Views on Vision4Press platform.
Data correspond to usage on the plateform after 2015. The current usage metrics is available 48-96 hours after online publication and is updated daily on week days.
Initial download of the metrics may take a while.