Fig. 2.
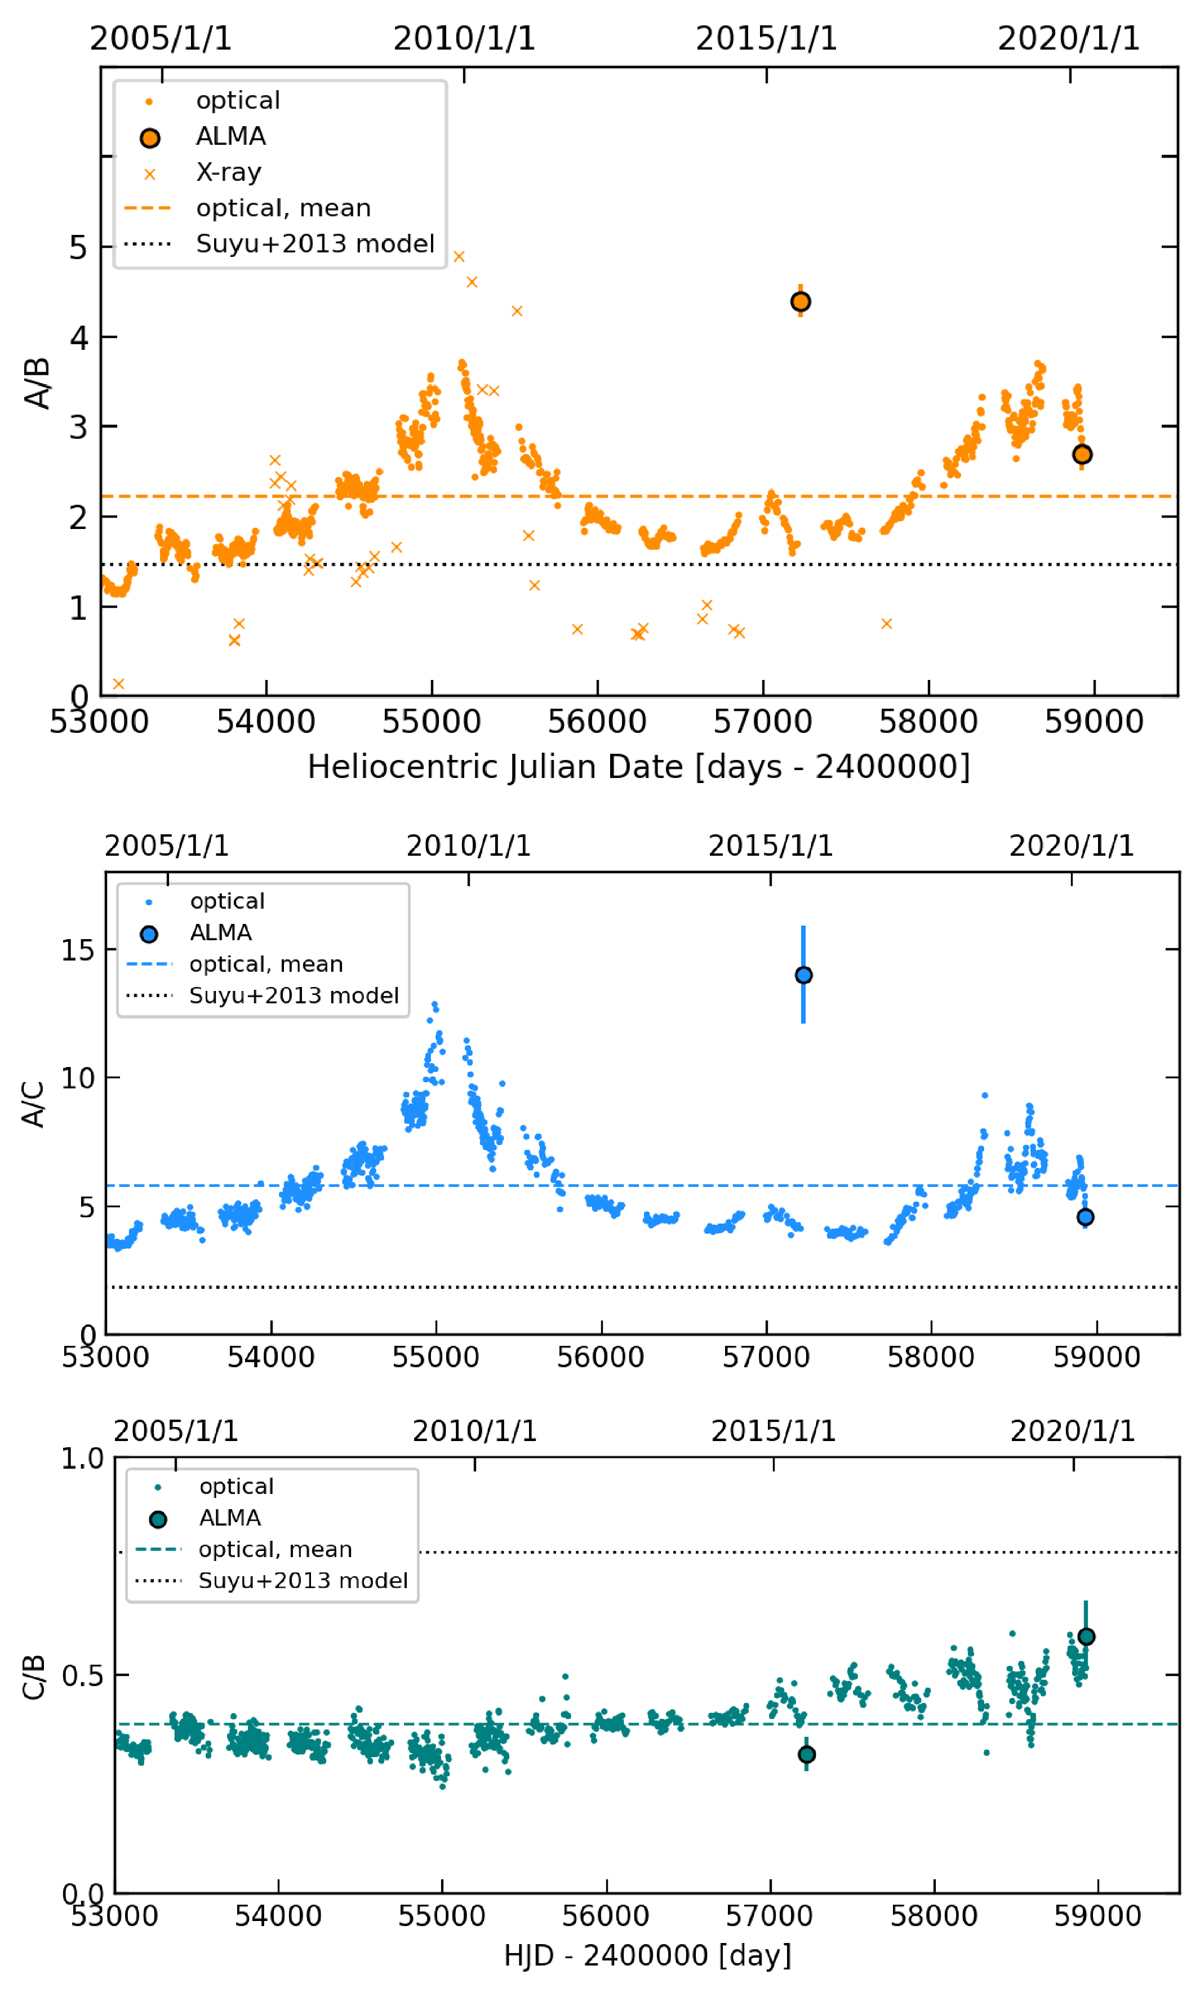
Download original image
Time evolution of the A/B, A/C, and C/B flux ratios as measured by ALMA, compared to the optical (COSMOGRAIL) and X-ray (Chandra) monitoring. We also show the average value of the R-band flux ratio (dashed line) and predicted value from the Suyu et al. (2013) lens model (dotted line). The amplitude of ALMA A/B flux ratio variations is comparable to that at optical and X-ray wavelengths but shifted in time, indicating different sizes or a spatial offset between the three components.
Current usage metrics show cumulative count of Article Views (full-text article views including HTML views, PDF and ePub downloads, according to the available data) and Abstracts Views on Vision4Press platform.
Data correspond to usage on the plateform after 2015. The current usage metrics is available 48-96 hours after online publication and is updated daily on week days.
Initial download of the metrics may take a while.