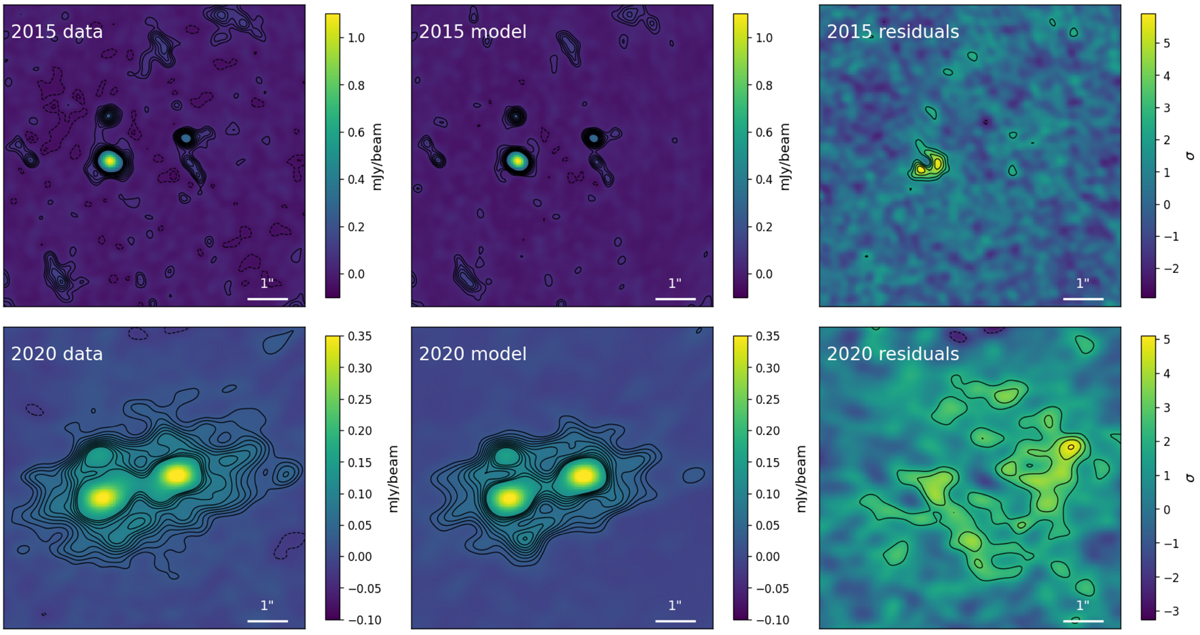
Fig. A.1.
Download original image
Results of the uv-fitting procedure. The individual columns show dirty images of the data, model, and the residuals (data minus model). The 2015 and 2020 observations are shown in the upper and lower row, respectively. The contours are drawn at ±(2, 3, 4, …)σ levels. After fitting the four point-sources, the 2015 data show significant (∼5σ) residuals around the A-image, likely dust in the circumnuclear region. For the 2020 data, residuals show the faint, extended emission from the cold dust in the gaseous disc.
Current usage metrics show cumulative count of Article Views (full-text article views including HTML views, PDF and ePub downloads, according to the available data) and Abstracts Views on Vision4Press platform.
Data correspond to usage on the plateform after 2015. The current usage metrics is available 48-96 hours after online publication and is updated daily on week days.
Initial download of the metrics may take a while.