Fig. 10.
Download original image
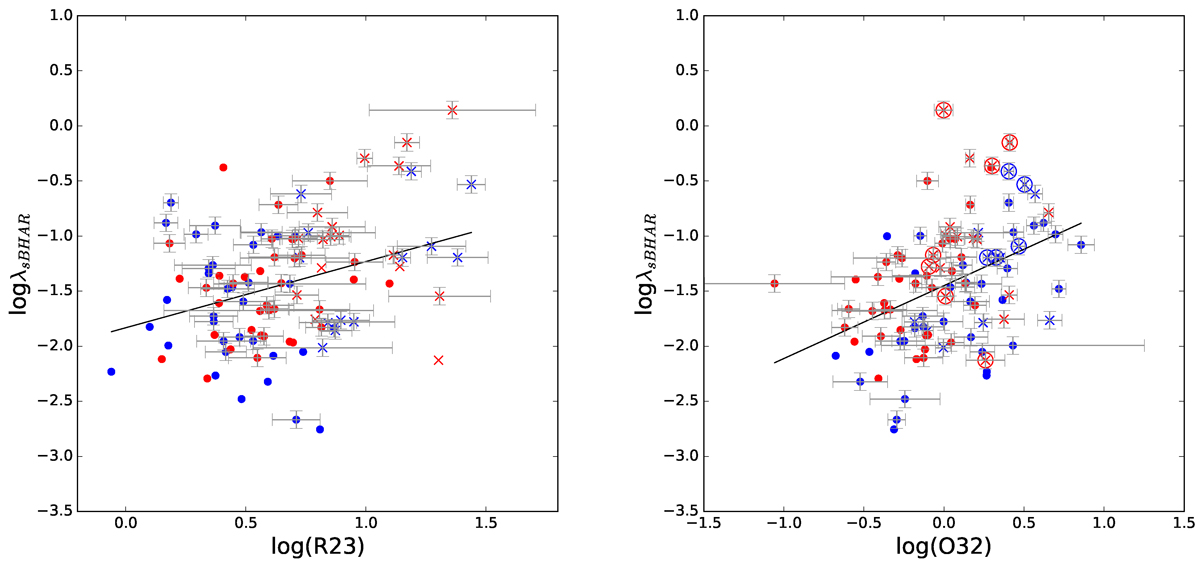
Specific black-hole accretion rate, λsBHAR, as function of R23 (left panel) and O32 (right panel) parameters for the different AGN samples. The plotted symbols are the same as those in Figure 9. Objects without error bars correspond to sources for which the uncertainty in the Hβ emission line is not available. Points enclosed by large circles represent sources with log(R23) > 1.
Current usage metrics show cumulative count of Article Views (full-text article views including HTML views, PDF and ePub downloads, according to the available data) and Abstracts Views on Vision4Press platform.
Data correspond to usage on the plateform after 2015. The current usage metrics is available 48-96 hours after online publication and is updated daily on week days.
Initial download of the metrics may take a while.