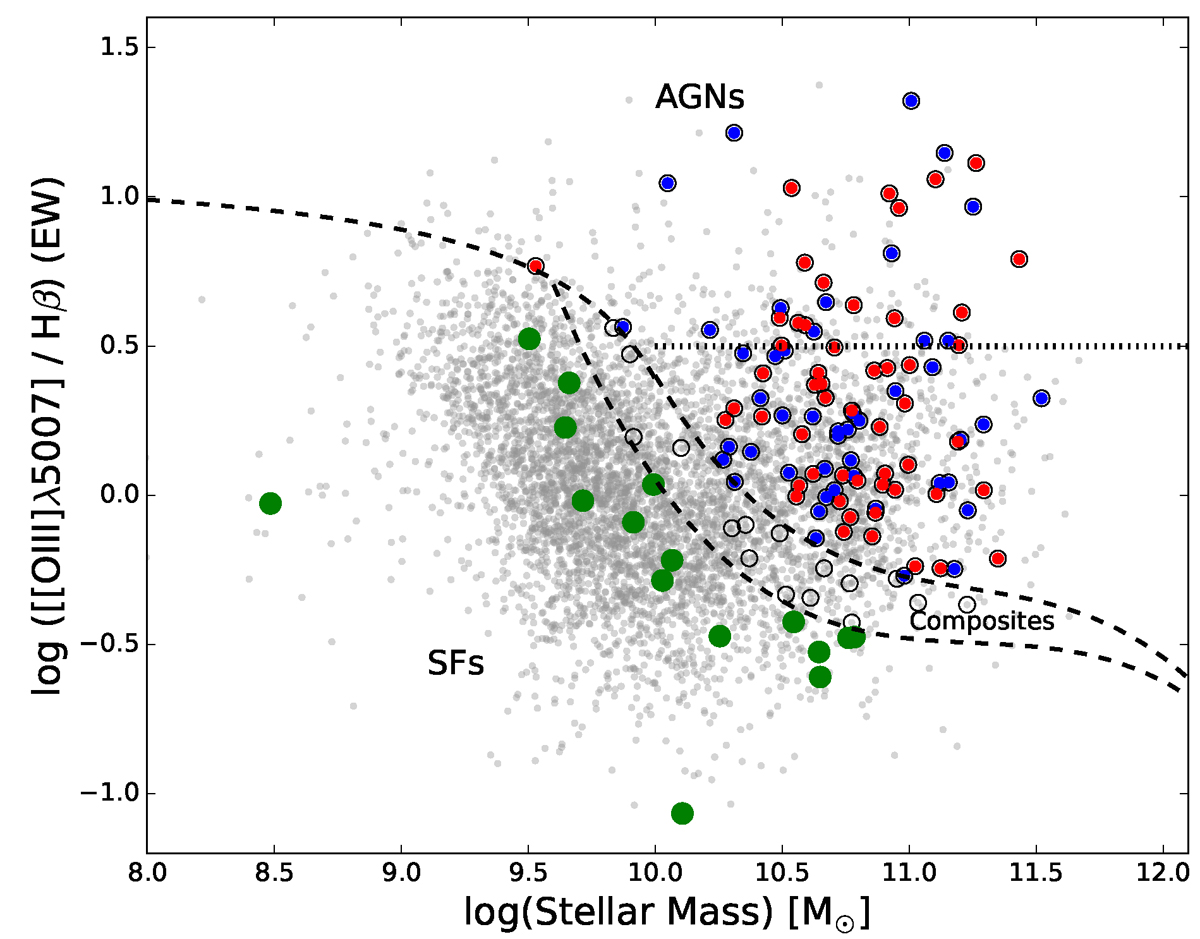
Fig. 2.
Download original image
Mass-excitation diagram. Grey dots represent galaxies in the zCOSMOS survey with ASPIC spectral-line measurements. The regions marked with dashed lines show the location of AGNs, composites, and star-forming galaxies. Grey circles represent X-ray sources, and red and blue circles represent obscured and unobscured AGNs with X-ray emission. Green circles denote X-ray-detected sources identified as star-forming galaxies. The dotted horizontal line at y = 0.5 shows the separation between high- and low-excitation AGNs.
Current usage metrics show cumulative count of Article Views (full-text article views including HTML views, PDF and ePub downloads, according to the available data) and Abstracts Views on Vision4Press platform.
Data correspond to usage on the plateform after 2015. The current usage metrics is available 48-96 hours after online publication and is updated daily on week days.
Initial download of the metrics may take a while.