Fig. 4.
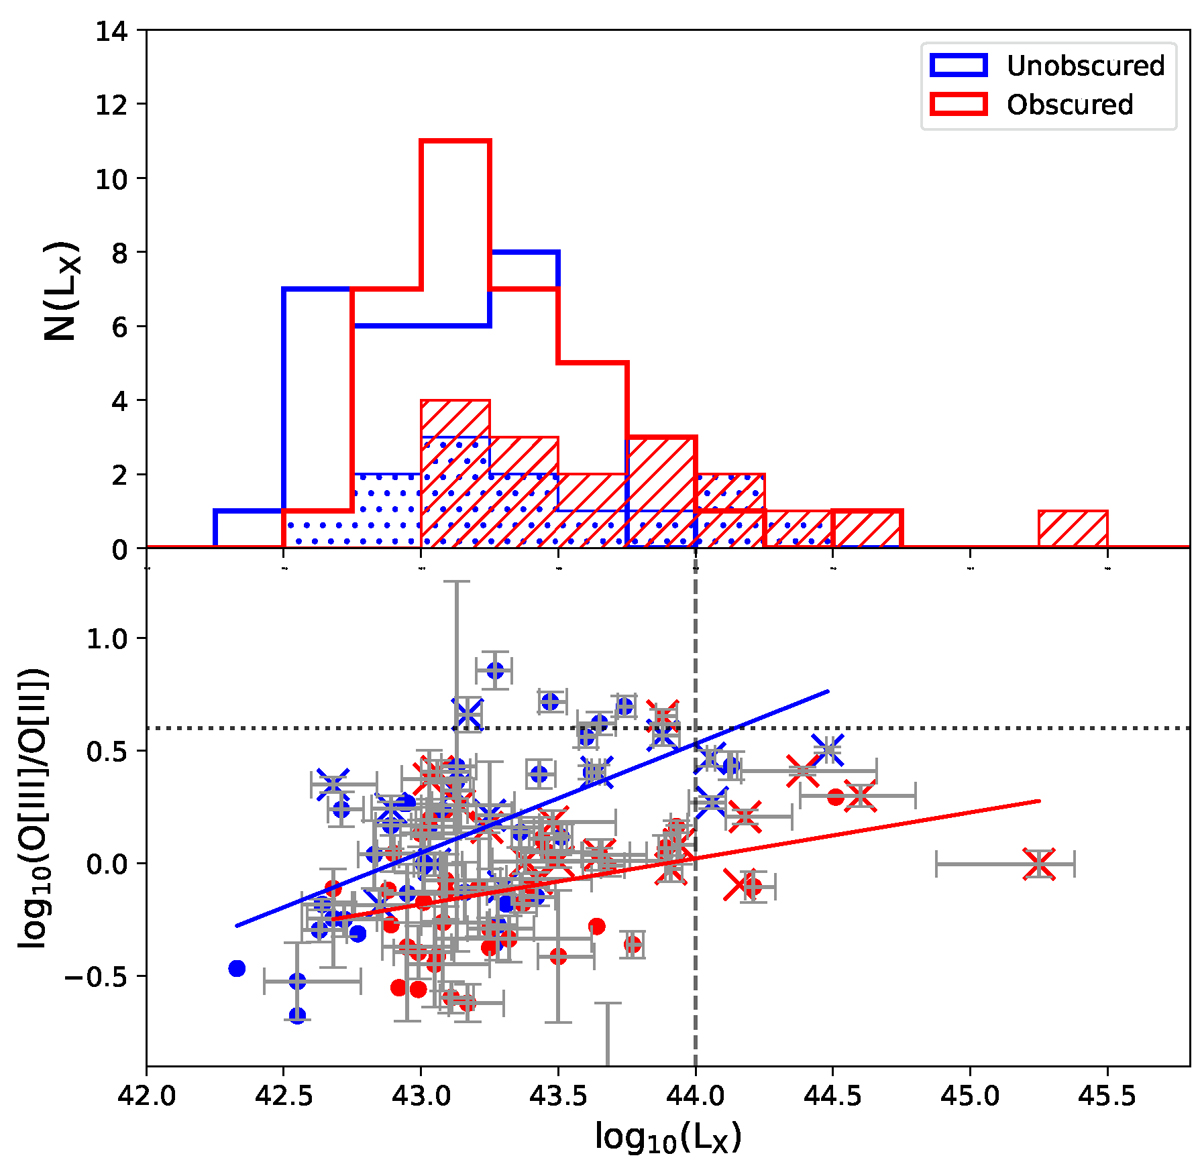
Download original image
Ionisation-level sensitive [O III]λ5007/[O II]λ3727 ratio as function of X-ray luminosity for the different AGN samples. Symbols are the same as in Figure 3. High-excitation obscured and unobscured AGNs are marked with ‘X’ symbols. Vertical dashed lines show the typical separation for AGNs and quasars used in the X-rays, and the horizontal lines show the limit for sources with high-ionisation values.
Current usage metrics show cumulative count of Article Views (full-text article views including HTML views, PDF and ePub downloads, according to the available data) and Abstracts Views on Vision4Press platform.
Data correspond to usage on the plateform after 2015. The current usage metrics is available 48-96 hours after online publication and is updated daily on week days.
Initial download of the metrics may take a while.