Fig. 5.
Download original image
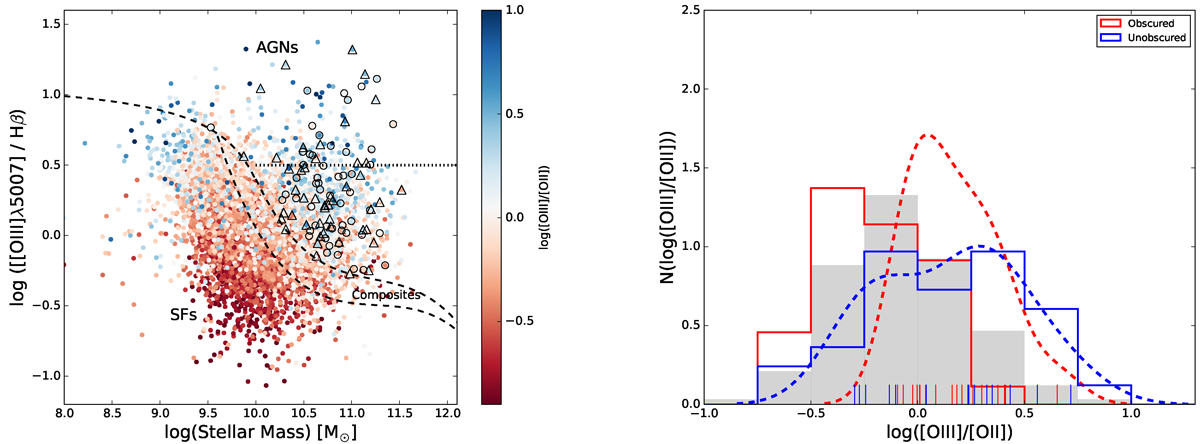
Left panel: Mass-excitation diagram for sample of galaxies in the zCOSMOS survey with ASPIC spectral-line measurements. Obscured AGNs with X-ray emission are plotted with open circles, and the unobscured sample is shown with open triangles. The dashed and dotted lines demarcate the same regions as those in Figure 2. Vertical colour bar shows the ionisation-level [O III]λ5007/[O II]λ3727 ratio values. Right panel: Ionisation-level [O III]λ5007/[O II]λ3727 ratio distributions for the different AGN samples. Red and blue solid line histograms represent the distribution for obscured and unobscured X-ray AGNs with low-excitation values. High-excitation AGNs are plotted with dashed line distributions that represent the kernel density estimates (KDEs) for obscured and unobscured X-ray AGNs. We also plot the individual observations with marginal ticks.
Current usage metrics show cumulative count of Article Views (full-text article views including HTML views, PDF and ePub downloads, according to the available data) and Abstracts Views on Vision4Press platform.
Data correspond to usage on the plateform after 2015. The current usage metrics is available 48-96 hours after online publication and is updated daily on week days.
Initial download of the metrics may take a while.