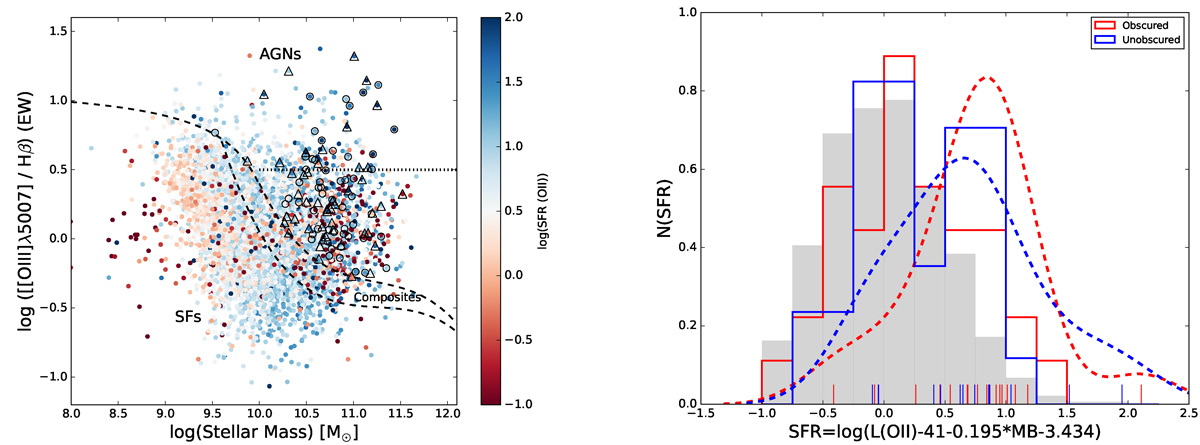
Fig. 6.
Download original image
Left panel: MEx diagram for sources in zCOSMOS and ASPIC catalogues. The vertical colour bar represents the SFR values obtained using the formula of Maier et al. (2009) from [O II] luminosity and MB magnitudes. AGNs are represented as in previous figures. Right panel: SFR distribution for different AGN samples. Colour-code and histogram lines are the same as in previous figures.
Current usage metrics show cumulative count of Article Views (full-text article views including HTML views, PDF and ePub downloads, according to the available data) and Abstracts Views on Vision4Press platform.
Data correspond to usage on the plateform after 2015. The current usage metrics is available 48-96 hours after online publication and is updated daily on week days.
Initial download of the metrics may take a while.