Fig. 8.
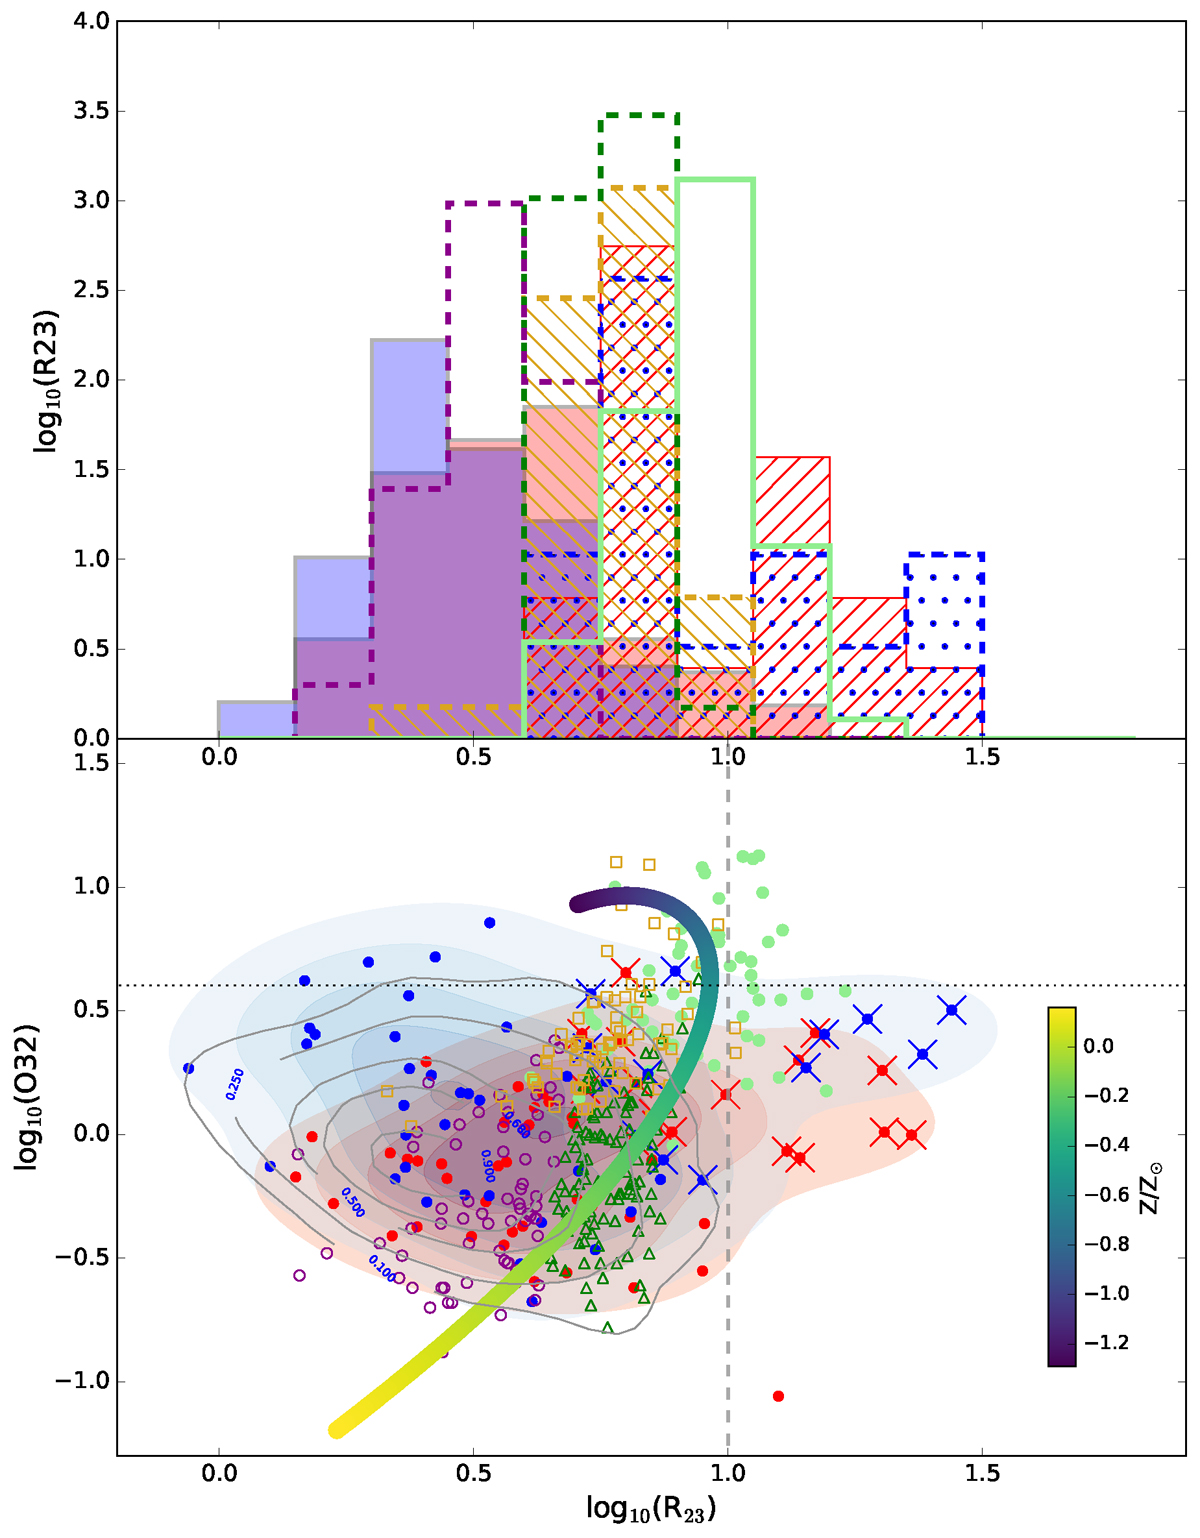
Download original image
Line-ratio diagnostic diagram of R23 = ([O III]λ5007+[O II]λ3727)/Hβ versus O32 = [O III]λ5007/[O II]λ3727). Obscured and unobscured AGNs are plotted with the same symbols as in the previous figures. Purple open circles and dark green triangles represent galaxies with high (12+log(O/H) > 8.8) and low (12+log(O/H) < 8.8) metallicity taken from Kobulnicky & Kewley (2004). Golden open squares represent the corresponding values for extreme emission-line galaxies out to z ∼ 1 in the zCOSMOS survey (Amorín et al. 2015). Light green filled circles represent high-redshift galaxies (4 < z < 6) with 12+log(O/H) < 8.5 from the JWST/NIRSpec survey (Nakajima et al. 2023). Grey contours show the corresponding distribution for MEx-selected AGNs without X-ray emission with the same redshift and stellar-mass limits as our AGN sample. The strong line diagnostic curve indicates the colour-coded metallicity values in solar units (Z/Z⊙) taken from Curti et al. (2017).
Current usage metrics show cumulative count of Article Views (full-text article views including HTML views, PDF and ePub downloads, according to the available data) and Abstracts Views on Vision4Press platform.
Data correspond to usage on the plateform after 2015. The current usage metrics is available 48-96 hours after online publication and is updated daily on week days.
Initial download of the metrics may take a while.