Fig. 9.
Download original image
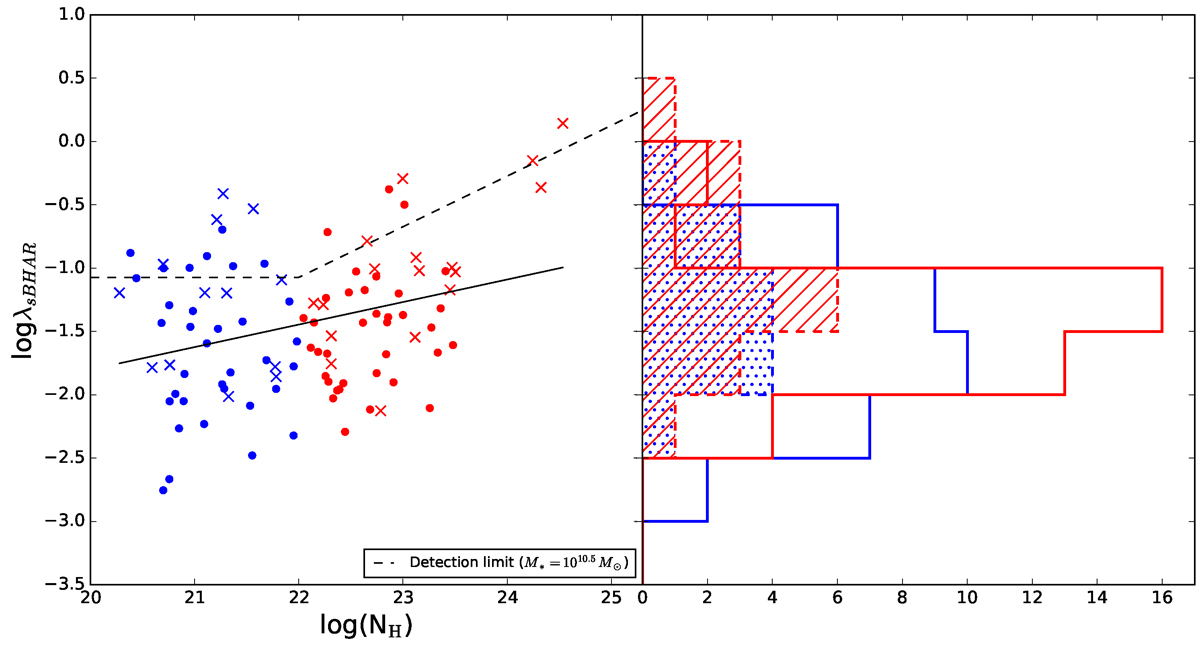
Specific black-hole accretion rate λsBHAR as a function of hydrogen column density, log(NH), for obscured and unobscured AGNs. Low (high) excitation obscured and unobscured AGNs are plotted with solid (Xs) red and blue circles. The dashed black line indicates the minimum detectable λsBHAR as a function of log(NH) for a fixed stellar mass of log(M*/M⊙)=10.5 and a mean redshift of z = 0.75. This detection limit accounts for the hard-band (2–10 keV) flux threshold and includes attenuation due to obscuration; this was estimated using an empirical transmission model. Sources lying below this line are likely to fall below the detection limit of the X-ray survey. In the right panel, we plot the corresponding distribution of λsBHAR for the different AGN samples. Solid red and blue distributions represent obscured and unobscured AGNs, while red dashed line and blue dotted line histograms correspond to high-excitation obscured and unobscured AGNs, respectively.
Current usage metrics show cumulative count of Article Views (full-text article views including HTML views, PDF and ePub downloads, according to the available data) and Abstracts Views on Vision4Press platform.
Data correspond to usage on the plateform after 2015. The current usage metrics is available 48-96 hours after online publication and is updated daily on week days.
Initial download of the metrics may take a while.