Fig. 2.
Download original image
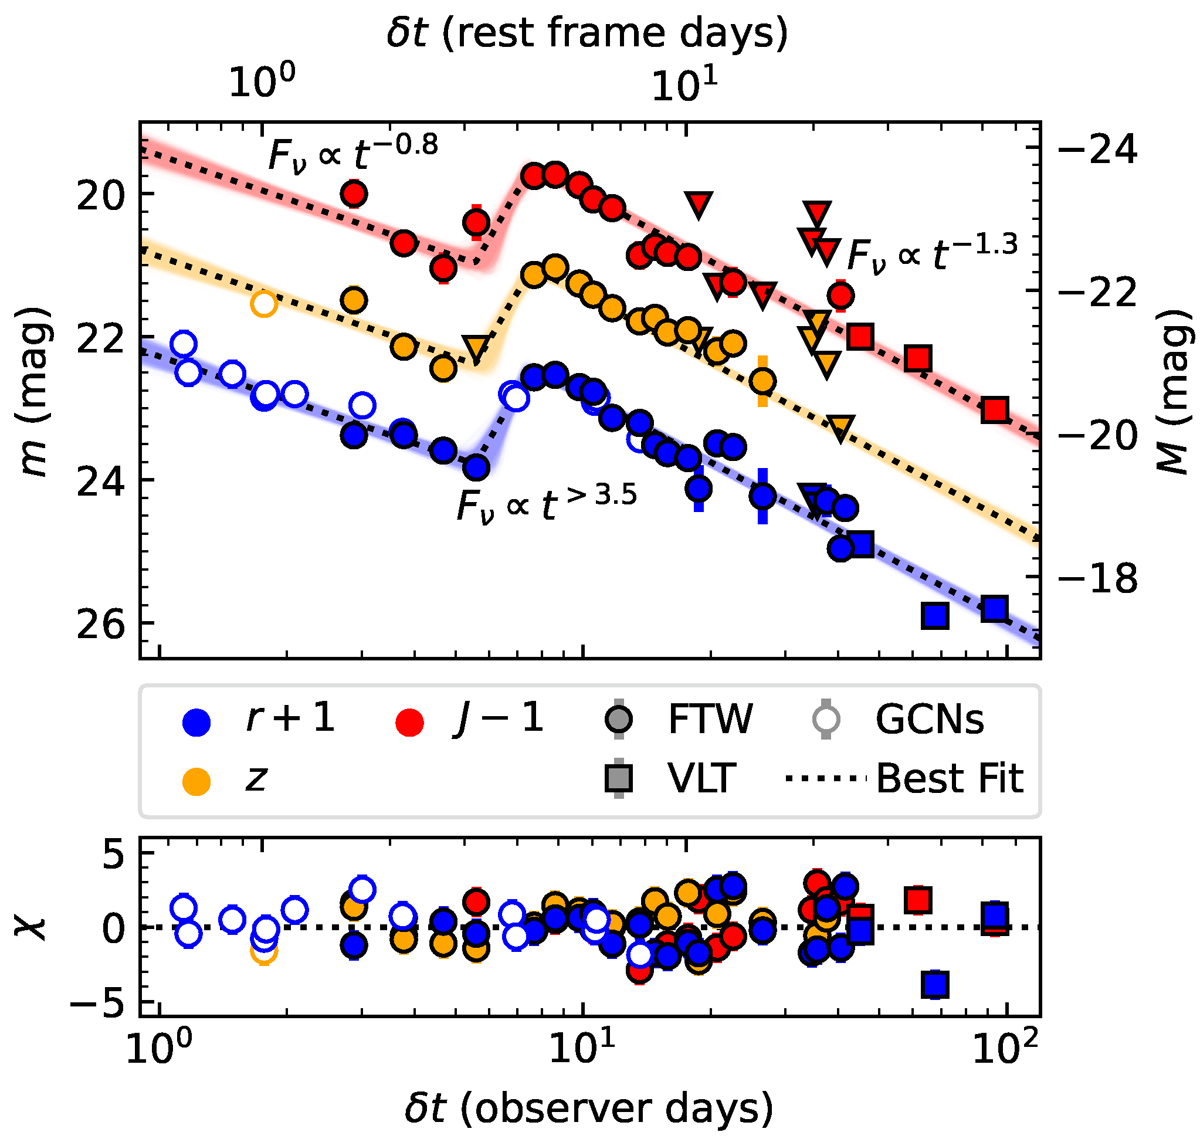
Top: Optical to near-infrared light curve of EP241021a in the r, i, and J filters. Our observations, obtained with the FTW and the VLT are supplemented with observations reported in General Coordinates Network (GCN) Circulars (Fu et al. 2024a,b; Li et al. 2024b; Ror et al. 2024; Li et al. 2024a; Zheng et al. 2024b; Pugliese et al. 2024; Bochenek & Perley 2024a; Quirola-Vasquez et al. 2024; Freeburn et al. 2024b; Schneider & Adami 2024b; Bochenek & Perley 2024b; Schneider & Adami 2024a). The best fit of the light curve using Equation 1 is indicated by the dotted lines, with 1000 random draws from the posterior plotted in the background. The Galactic extinction-corrected apparent magnitude, m, is shown on the left ordinate, and the K-corrected absolute magnitude, M, assuming z = 0.748 is shown on the right (see Section 3.3). The lower abscissa indicates the time since the EP trigger in the observer frame, while the upper axis is converted to the rest frame of the source. Bottom: Deviation of the data from the best fit, normalized by their uncertainties. The symbols are the same as for the upper panel but with no offset applied. The x-axes are identical to those in the top panel.
Current usage metrics show cumulative count of Article Views (full-text article views including HTML views, PDF and ePub downloads, according to the available data) and Abstracts Views on Vision4Press platform.
Data correspond to usage on the plateform after 2015. The current usage metrics is available 48-96 hours after online publication and is updated daily on week days.
Initial download of the metrics may take a while.