| Issue |
A&A
Volume 701, September 2025
|
|
|---|---|---|
| Article Number | A225 | |
| Number of page(s) | 21 | |
| Section | Extragalactic astronomy | |
| DOI | https://doi.org/10.1051/0004-6361/202554626 | |
| Published online | 17 September 2025 | |
The curious case of EP241021a: Unraveling the mystery of its exceptional rebrightening
1
University Observatory, Faculty of Physics, Ludwig-Maximilians-Universität München, Scheinerstr. 1, 81679 Munich, Germany
2
McWilliams Center for Cosmology and Astrophysics, Department of Physics, Carnegie Mellon University, Pittsburgh, PA, 15213
USA
3
Excellence Cluster ORIGINS, Boltzmannstr. 2, 85748 Garching, Germany
4
Department of Natural Sciences, The Open University of Israel, PO Box 808 Ra’anana, 43537
Israel
5
Astrophysics Research Center of the Open university (ARCO), The Open University of Israel, PO Box 808 Ra’anana, 43537
Israel
6
Department of Physics, The George Washington University, Washington, DC, 20052
USA
7
Instituto de Radioastronomía y Astrofísica, Universidad Nacional Autónoma de México, Antigua Carretera a Pátzcuaro # 8701, Ex-Hda. San José de la Huerta, Morelia, Michoacán, C.P. 58089
Mexico
8
Astrophysics Science Division, NASA Goddard Space Flight Center, Mail Code 661, Greenbelt, MD, 20771
USA
9
NASA Postdoctoral Program Fellow, NASA Goddard Space Flight Center, Greenbelt, MD, 20771
USA
10
Max-Planck-Institut für Extraterrestrische Physik, Giessenbachstraße 1, 85748 Garching, Germany
11
Department of Physics, University of Rome “Tor Vergata”, Via della Ricerca Scientifica 1, I-00133 Rome, Italy
12
Department of Astronomy and Astrophysics, The Pennsylvania State University, 525 Davey Lab, University Park, PA, 16802
USA
13
INAF-Istituto di Radioastronomia, Via Gobetti 101, I-40129 Bologna, Italy
14
Center for Space Sciences and Technology, University of Maryland, Baltimore County, Baltimore, MD, 21250
USA
15
Center for Research and Exploration in Space Science and Technology, NASA/GSFC, Greenbelt, Maryland, 20771
USA
16
Perimeter Institute for Theoretical Physics, Waterloo, Ontario, N2L 2Y5
Canada
17
University of Texas, Hobby–Eberly Telescope, McDonald Observatory, TX, 79734 USA
⋆ Corresponding authors: This email address is being protected from spambots. You need JavaScript enabled to view it.
, This email address is being protected from spambots. You need JavaScript enabled to view it.
Received:
18
March
2025
Accepted:
3
July
2025
Abstract
Context. Fast X-ray transients (FXTs) are a rare and poorly understood phenomenon with a variety of possible progenitors. The launch of the Einstein Probe (EP) mission has facilitated a rapid increase in the real-time discovery and follow-up of FXTs.
Aims. We focus on the recent EP discovered transient EP241021a, which shows a peculiar panchromatic behavior, with the aim of understanding its origin.
Methods. We obtained optical and near-infrared multiband imaging and spectroscopy with the Fraunhofer Telescope at Wendelstein Observatory, the Hobby-Eberly Telescope, and the Very Large Telescope of the newly discovered EP transient EP241021a over the first 100 days of its evolution.
Results. EP241021a was discovered by EP as a soft X-ray trigger, but was not detected at gamma-ray frequencies. The observed soft X-ray prompt emission spectrum is consistent with nonthermal radiation, which requires at least a mildly relativistic outflow with a bulk Lorentz factor Γ ≳ 4. The optical and near-infrared light curve displays a two-component behavior, where an initially fading component, ∼ t−1, transitions to a rise steeper than ∼ t3 after a few days, before peaking at an absolute magnitude of Mr ≈ −21.8 mag and quickly returning to the initial decay. Standard supernova models are unable to reproduce either the absolute magnitude or the rapid timescale (< 2 d) of the rebrightening. The X-ray, optical and near-infrared spectral energy distributions display a red color, r − J ≈ 0.8 mag, and point to a nonthermal origin (∼ ν−1) for the broadband emission. Considering a gamma-ray burst as a plausible scenario, we favor a refreshed shock as the cause of the rebrightening. This is consistent with the inference of an at least mildly relativistic outflow based on the prompt trigger.
Conclusions. Our results suggest a link between EP-discovered FXTs and gamma-ray bursts, despite the lack of gamma-ray detections for the majority of EP transients.
Key words: radiation mechanisms: non-thermal / shock waves / gamma-ray burst: general / stars: jets
Recipient of a Wübben Stiftung Wissenschaft Student Grant.
McWilliams Fellow.
© The Authors 2025
 Open Access article, published by EDP Sciences, under the terms of the Creative Commons Attribution License (https://creativecommons.org/licenses/by/4.0), which permits unrestricted use, distribution, and reproduction in any medium, provided the original work is properly cited.
This article is published in open access under the Subscribe to Open model. This email address is being protected from spambots. You need JavaScript enabled to view it. to support open access publication.
1. Introduction
In recent years, a variety of gamma-ray burst (GRB) afterglows have been discovered without gamma-ray triggers (e.g., Lipunov et al. 2022; Ho et al. 2022; Perley et al. 2025; Li et al. 2025a; Srinivasaragavan et al. 2025a). These discoveries have been made largely through wide-field optical surveys such as the Zwicky Transient Facility (ZTF), although other attempts have been reported (Freeburn et al. 2024a). These “orphan” afterglows (Nakar et al. 2002; Huang et al. 2002; Rhoads 2003) are generally observed as fast-fading red transients and are found at cosmological distances around z ≈ 1 (e.g., Ho et al. 2022). A general issue, due largely to the lack of direct knowledge of the onset time of the initial GRB or afterglow, is whether these events truly lack gamma-ray emission, whether it was simply missed by gamma-ray monitors, or whether the gamma-ray emission is simply underluminous or has a low peak energy Ep. They are often suggested to be mildly relativistic outflows (e.g., Perley et al. 2025; Li et al. 2025a; Srinivasaragavan et al. 2025a), though slightly off-axis viewing angles cannot be ruled out as an alternative explanation (e.g., Li et al. 2025a).
The Einstein Probe (EP) is a new soft X-ray mission (Yuan et al. 2015, 2022, 2025) with wide-field capabilities. The Wide-field X-ray Telescope (WXT) has an instantaneous field of view (FOV) of 3600 deg2, observing in the soft X-ray band between 0.4 − 4.0 keV. This revolutionary wide-field X-ray survey capability, combined with on-board triggering, is capable of unlocking the previously hidden transient X-ray sky. It acts in a similar fashion for X-ray transients as gamma-ray monitors such as the Neil Gehrels Swift Observatory (Gehrels et al. 2004) and the Fermi Gamma-ray Space Telescope (Meegan et al. 2009) do for GRBs.
In the first year since its launch, EP has rapidly identified a number of rare fast X-ray transients (FXTs; Alp & Larsson 2020; Quirola-Vásquez et al. 2022, 2023, 2024), allowing key follow-up at other wavelengths. Many of these onboard EP/WXT triggers have been identified as extragalactic transients. These include subthreshold events that were later identified by gamma-ray satellites in a ground-based analysis but did not trigger onboard the gamma-ray spacecraft, such as EP240219a (Yin et al. 2024), EP240315a/GRB 240315C (Levan et al. 2024; Liu et al. 2025; Gillanders et al. 2024; Ricci et al. 2025), and EP240801a (Jiang et al. 2025). However, many extragalactic EP transients are not detected by any other high-energy monitors, such as EP240408a (O’Connor et al. 2025; Zhang et al. 2025), EP240414a (Srivastav et al. 2025; van Dalen et al. 2025; Bright et al. 2025; Sun et al. 2025), and EP250108a (Rastinejad et al. 2025; Eyles-Ferris et al. 2025; Srinivasaragavan et al. 2025b; Li et al. 2025b). The EP/WXT triggers for some of these transients robustly constrain the peak energy, Ep, of their prompt emission to soft X-rays (e.g., EP240414a, EP240801a, EP250108a; Liu et al. 2025; Jiang et al. 2025; Li et al. 2025b). This may help explain the lack of clear gamma-ray detections in at least a handful of sources. Comprehensive multiwavelength follow-up is urgently required to reveal the nature and astrophysical diversity of these events.
Of particular interest in the case of EP240414a (z = 0.4) are its multiple optical emission components (Srivastav et al. 2025; van Dalen et al. 2025; Sun et al. 2025), including clear spectroscopic evidence for a supernova (SN) at late times (see van Dalen et al. 2025). The initially fading optical light curve displayed rapid rebrightening after a few days, with possible interpretations including a refreshed shock (Srivastav et al. 2025), a “failed” jet breakout due to an extended circumstellar envelope (Hamidani et al. 2025), the combination of a cocoon and supernova ejecta interacting with the surrounding circumstellar material (van Dalen et al. 2025), or an off-axis jet-cocoon system (Zheng et al. 2025). It is also possible that EP240414a represents an entirely different class of transient that had not been previously observed.
In this paper, we present our multiwavelength campaign targeting the recently discovered EP241021a. We find that EP241021a exhibits a behavior similar to that of EP240414a, with multiple, clearly distinct emission episodes. Localized to redshift z = 0.748 (Pugliese et al. 2024; Pérez-Fournon et al. 2024; Zheng et al. 2024a; Shu et al. 2025), the optical light curve of EP241021a was initially observed as a fading source, but quickly exhibited a luminous rebrightening on a short timescale of only a few days, reaching an absolute magnitude of Mr ≈ −21.8 mag. We analyzed the X-ray, optical, and near-infrared dataset of EP241021a to determine whether it requires multiple emission components, or whether it can potentially be explained by the same outflow. We further connect EP241021a to the earlier peculiar EP transient EP240414a and discuss possible interpretations of their multiwavelength behavior.
Throughout the manuscript, we adopt a standard ΛCDM cosmology (Planck Collaboration VI 2020) with H0 = 67.4 km s−1 Mpc−1, Ωm = 0.315, and ΩΛ = 0.685. We also adopt the convention for the flux density, Fν ∝ tανβ, where α is the temporal index and β is the spectral index. All upper limits are reported at 3σ and all magnitudes are in the AB system.
2. Observations
2.1. Prompt X-ray trigger and gamma-ray limits
The WXT onboard the EP (Yuan et al. 2015, 2022, 2025) triggered on EP241021a on 2024 October 21 at 05:07:56 UT (Hu et al. 2024). The source had a duration of ∼100 s, with a time-averaged X-ray flux (0.5 − 4.0 keV) of  erg cm−2 s−1 (see Shu et al. 2025 for a refined analysis and discussion of the EP/WXT trigger). The soft X-ray fluence is approximately 3.3 × 10⁻⁸ erg cm−2, yielding an estimate of the isotropic-equivalent energy (0.5 − 4.0 keV; rest frame) of
  erg at z = 0.748 (Shu et al. 2025). To compute the K-correction k(z) = (1 + z)−Γ − 2, used to convert the observed emission to the rest-frame 0.5 − 4.0 keV bandpass, we adopted a power-law spectrum N(E) ∝ EΓ, with a photon index Γ =
  (Shu et al. 2025) in the observer frame 0.5 − 4.0 keV energy range as reported for the WXT trigger (Hu et al. 2024).
At the time of the EP trigger, Konus-Wind was observing the entire sky but did not detect EP241021a in gamma rays (Svinkin & Frederiks 2024). The 90% confidence upper limit on the peak gamma-ray flux (20 − 1500 keV) is < 2.5 × 10⁻⁷ erg cm−2 s−1, assuming a timescale of 2.944 s (Svinkin & Frederiks 2024). We adopted a typical long GRB spectrum characterized by a Band function (Band et al. 1993), with a peak energy Ep = 300 keV and low-energy and high-energy photon indices of −1 and −2.5, respectively (e.g., Nava et al. 2011). This bolometric correction yields a 90% confidence upper limit to the isotropic-equivalent gamma-ray energy of ≲1051 erg in the rest-frame 1 − 10 000 keV energy range, assuming a timescale of 2.944 s for the prompt gamma-ray emission duration. If instead we assume that the gamma-ray duration is equal to the X-ray duration (∼100 s), we find a less restrictive limit of ≲4 × 1052 erg. Past joint EP-GRB detections have shown that the soft X-ray duration can be significantly longer than the higher-energy gamma-ray emission (see, e.g., Yin et al. 2024; Liu et al. 2025; Yin et al. 2025). We discuss these implications further in Sect. 4.3.
2.2. Fraunhofer Telescope at Wendelstein Observatory
We observed the optical and near-infrared (OIR) counterpart of EP241021a using the Three Channel Imager (3KK; Lang-Bardl et al. 2016) on the 2.1 m Fraunhofer Telescope at Wendelstein Observatory (FTW; Hopp et al. 2014) located on Mt. Wendelstein at the northern edge of the Alps. The 3KK instrument can simultaneously observe a 7′×7′ FOV in three channels. The blue channel can observe either in the u′, g′, or r′ band, the red channel in the i′or z′band, and the near-infrared (NIR) channel supports the Y, J, H, and Ks bands. We obtained data 22 times between 2024 October 23 at 02:12:17 UT (2.8 d after the EP/WXT trigger) and 2024 December 01 at 18:26:38 UT (43 d after the EP/WXT trigger) in the r′, i′, z′, J, and H bands. The majority of observations were obtained simultaneously in the r′z′J filters.
The optical CCD data were reduced and analyzed using a custom data analysis pipeline based on Gössl & Riffeser (2002), applying standard image processing techniques such as bias and dark subtraction, flat-fielding, cosmic ray rejection, and other corrections. For the infrared CMOS images, dedicated software developed internally at Wendelstein Observatory was used to calculate Fowler-sampled stacks from the individual sample-up-the-ramp exposure series (Fowler & Gatley 1990). This software also accounts for CMOS non-linearity and removes rapidly changing bias patterns by subtracting appropriate flux-conserving wavelets. These images were then processed using the same pipeline as bias- and dark-corrected CCD frames. The images were stacked using tools from the AstrOmatic software suite (Bertin & Arnouts 1996; Bertin 2006; Bertin et al. 2002). To account for time-dependent changes in the background, the background was modeled and subtracted for each individual frame using tools provided by SWarp (Bertin et al. 2002; Bertin & Arnouts 1996). The OIR counterpart is detected throughout our observations (see Figure 1), which comprises a total of 38.1 h of exposure with the 3KK imager. Archival observations as part of the DESI Legacy Surveys do not reveal an underlying galaxy to deep limits (Fu et al. 2024a). Therefore, we did not perform difference imaging because of the lack of existing templates or known host galaxy brightness. Aperture photometry of the OIR counterpart was computed using Photutils (Bradley et al. 2024) and calibrated against the 2MASS (Skrutskie et al. 2006) and Pan-STARRS1 (PS1; Chambers et al. 2016) catalogs. We utilized an annulus placed around the circular source aperture to estimate and subtract the local background. The photometry is presented in Table A.1 and is shown in Figure 2.
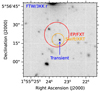 |
Fig. 1. Finding chart of EP241021a combining all FTW r-band exposures (38.1 h total). The location of the transient (blue) lies within the X-ray localizations from Swift/XRT (orange) and EP/FXT (red). |
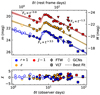 |
Fig. 2. Top: Optical to near-infrared light curve of EP241021a in the r, i, and J filters. Our observations, obtained with the FTW and the VLT are supplemented with observations reported in General Coordinates Network (GCN) Circulars (Fu et al. 2024a,b; Li et al. 2024b; Ror et al. 2024; Li et al. 2024a; Zheng et al. 2024b; Pugliese et al. 2024; Bochenek & Perley 2024a; Quirola-Vasquez et al. 2024; Freeburn et al. 2024b; Schneider & Adami 2024b; Bochenek & Perley 2024b; Schneider & Adami 2024a). The best fit of the light curve using Equation 1 is indicated by the dotted lines, with 1000 random draws from the posterior plotted in the background. The Galactic extinction-corrected apparent magnitude, m, is shown on the left ordinate, and the K-corrected absolute magnitude, M, assuming z = 0.748 is shown on the right (see Section 3.3). The lower abscissa indicates the time since the EP trigger in the observer frame, while the upper axis is converted to the rest frame of the source. Bottom: Deviation of the data from the best fit, normalized by their uncertainties. The symbols are the same as for the upper panel but with no offset applied. The x-axes are identical to those in the top panel. |
Using the stack of all 3KK r-band data (Figure 1), we localize the optical source to RA, Dec (J2000) = 01h55m23s.430, +05° 56′17.86″ with a total positional uncertainty (systematic and statistical) of 0.10″ at 1σ confidence level (CL), or 0.15″ at the 90% CL. The statistical uncertainty on the source position is 0.008″ (1σ CL) in both RA and DEC. The position and its statistical uncertainty were calculated by fitting the source’s point spread function with a Moffat profile using the photutils (Bradley et al. 2024) package. The systematic (absolute) astrometric tie uncertainty of 0.10″ (1σ CL) in both right ascension (RA) and declination (DEC) for sources in the field relative to Gaia EDR3 (Gaia Collaboration 2021; Lindegren et al. 2021; Gaia Collaboration 2020) was computed using SCAMP (Bertin 2006).
2.3. Hobby-Eberly Telescope
We observed EP241021a with the 11 m Hobby-Eberly Telescope (HET; Ramsey et al. 1998; Hill et al. 2021) at McDonald Observatory under program M24-3-005 (PI: Gruen) on 2024 October 25, 2024 October 29, and 2024 November 26 (see Table A.2). The observations were scheduled using the HET queue-scheduling system (Shetrone et al. 2007). We used the low-resolution integral-field spectrograph (LRS2; Chonis et al. 2014, 2016) to obtain spectra in both wavelength channels with LRS2-B (370–700 nm) and LRS2-R data (650–1050 nm). Data were obtained from LRS2-B on 2024 October 25 and LRS2-R on both 2024 October 29 and 2024 November 26 (Table A.2). The raw LRS2 data were initially processed with Panacea1, which performs bias subtraction, dark subtraction, fiber tracing, fiber wavelength evaluation, fiber extraction, fiber-to-fiber normalization, source detection, source extraction, and flux calibration for each channel. The absolute flux calibration was based on default response curves, measurements of mirror illumination, and exposure throughput derived from guider images. We extracted the flux-calibrated one-dimensional spectrum using the LRS2Multi2 package, integrating over the 0.59″ fibers within a 1.0 − 1.5″ aperture centered on EP241021a. The signal-to-noise ratio (S/N) in these observations is very low, and the continuum is not clearly detected. We identify only a single emission feature at 6519 Å, likely corresponding to [OII]λ3729 at z = 0.748, consistent with previous redshift measurements from underlying emission and absorption lines in the transient spectrum (Pugliese et al. 2024; Shu et al. 2025). Integrating over the fibers in a 1.0″ aperture in the wavelength range centered at 6519 ± 10 Å (with a full width at half maximum of 5 Å), we find a S/N of 9.3 using the LRS2-R spectrum from 2024 October 29. The LRS2-R spectrum from 2024 October 29, when the transient was brightest relative to other epochs, is shown in Figure 3.
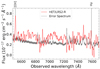 |
Fig. 3. Optical spectrum of EP241021a obtained on 2024 October 29 using LRS2-R at HET, shown in red, with the associated error spectrum in gray. No clear continuum is detected, but a single emission feature corresponding to [OII]λ3729 at z = 0.748 is identified. This is consistent with previous reports of emission features underlying EP241021a (Shu et al. 2025). For display purposes, the data are smoothed with a Savitzky–Golay filter of 5 pixels. |
2.4. Very Large Telescope
We carried out multiband imaging observations of EP241021a with the Very Large Telescope (VLT) at Cerro Paranal, Chile, with the FORS2 (Appenzeller et al. 1998) and HAWK-I (Kissler-Patig et al. 2008) instruments, under program 114.27LW (PI: Troja). Data were obtained on 2024 December 05 and 2024 December 28 in the R-band (1200 s) with FORS2, and on 2024 December 05 and 2024 December 22 in the J-band (900 s) with HAWK-I. Additional data were obtained on 2025 January 23 in both filters, with integration times of 1200 s. The data were reduced using the standard ESO data reduction pipelines, and the individual images were combined using SWarp (Bertin 2010) to create a stacked image. Aperture photometry was performed using SExtractor (Bertin & Arnouts 1996), with a circular aperture whose diameter was set to twice the seeing (full width at half maximum of isolated, unsaturated point sources) for each epoch. The SExtractor parameters were set as described in O’Connor et al. (2022). We calibrated the photometry using isolated, unsaturated point sources in the 2MASS (Skrutskie et al. 2006) and PS1 (Chambers et al. 2016) catalogs for the R- and J-band, respectively.
2.5. Neil Gehrels Swift Observatory
The position of EP241021a was observed by the Neil Gehrels Swift Observatory (hereafter Swift; Gehrels et al. 2004) X-ray Telescope (XRT; Burrows et al. 2005a) between 2024 October 24 and 2024 November 15 (ObsIDs: 21725 and 1889), during seven visits totaling 17.5 ks in Photon Counting (PC) mode. We used the Swift/XRT data products generator3 to analyze these data. An X-ray source was detected on 2024 October 29, 2024 November 07, and 2024 November 15, and localized to RA, DEC (J2000) = 01h55m23s.53, +05° 56′18.3″ with an uncertainty of 4.9″ (90% CL). This position is consistent with the optical localization of the transient.
The X-ray source is weak and the spectrum is not well constrained. A fit to the time-averaged X-ray spectrum with an absorbed power-law model yields a photon index of Γ ≈  and an unabsorbed energy conversion factor of ≈3.3 × 10⁻¹¹ erg cm−2 cts−1, with the hydrogen column density fixed to the line-of-sight Galactic value (NH = 5 × 1020 cm−2, Willingale et al. 2013). The log of X-ray observations is provided in Table A.3.
The Swift Ultra-Violet Optical Telescope (UVOT; Roming et al. 2005) observed EP241021a simultaneously with XRT. The source was detected only in a single epoch on 2024 October 29, as previously reported by Klingler et al. (2024). We extracted upper limits at the source position in all other epochs using the uvotsource task within HEASoft software. The results are presented in Table A.1.
3. Analysis and results
3.1. Temporal evolution
The optical and near-infrared light curve of EP241021a shows two clear emission episodes (Figure 2). Around one day after the EP trigger, the optical emission was found to be rapidly fading (e.g., Fu et al. 2024a,b; Li et al. 2024b; Ror et al. 2024; Li et al. 2024a); however, at approximately seven days (observer frame; e.g., Quirola-Vasquez et al. 2024; Freeburn et al. 2024b) the transient was observed to have rapidly brightened by about 1 mag, peaking near eight days (observer frame). After the peak, the transient returned to a steep decay. Our observations with FTW began at 2.9 days (observer frame; see Table A.1). We supplemented our dataset with early-time photometry reported in GCN Circulars4, as shown in Figure 2.
As described above, the light curve behavior can be clearly separated into two components (Figure 2), which we refer to as the first and second components, respectively. We define the first component as the early fading behavior at less than six days (observer frame) and the second component as all other OIR data obtained between approximately six and 100 days. To constrain the temporal behavior, we model the OIR light curve, including both components, with a double smoothly broken power law, Fν ∝ tα, where α is the temporal slope: α1 refers to the initial fading segment, α2 is the rising slope, and α3 is the post-peak decay. The full equation used in the fit is
![Mathematical equation: $$ \begin{aligned} f(t,\nu ) = A\nu ^{\beta } \left( \frac{t}{t_1} \right)^{\alpha _1}\! \left[ \frac{1}{2} \! \left( 1 \!+\! \frac{t}{t_1} \right)^\frac{1}{\Delta _1}\! \right]^{(\alpha _2 - \alpha _1)\Delta _1} \! \left[ \frac{1}{2}\! \left( 1 \!+ \!\frac{t}{t_2} \right)^\frac{1}{\Delta _2}\! \right]^{(\alpha _3 - \alpha _2)\Delta _2}, \end{aligned} $$](/articles/aa/full_html/2025/09/aa54626-25/aa54626-25-eq5.gif) (1)
(1)
where t1 (rise) and t2 (peak) are the temporal breaks, measured in units of observer frame days; Δ1 and Δ2 are the smoothness parameters; and β is the spectral index. In Equation (1), we assume that the source spectral energy distribution (SED) is described by a single power law νβ, without additional curvature from added dust. We discuss the source SED further in Section 3.2 to justify the choice of a single power law with no additional intrinsic dust, beyond correcting for Galactic extinction (Schlafly & Finkbeiner 2011). For the fit, ν is expressed in units of 1014 Hz. The priors used for the fits are listed in Table B.1 in Appendix B.
We fit Equation (1) to the full light curve shown in Figure 2, using all filters (r, z and J) simultaneously, where the offset between filters is determined by the optical-to-near-infrared spectral index β and the multiplicative constant A (see Equation (1)). The photometry was corrected for Galactic extinction E(B − V) = 0.045 mag (Schlafly & Finkbeiner 2011). Parameter estimation was performed using the emcee (Foreman-Mackey et al. 2013) and ChainConsumer (Hinton 2016) packages.
The best-fit results of our temporal fit to the light curves are shown in Figure 2. The initial segment shows a decay of α1 = −0.81 ± 0.07, followed by a steep rise with α2 =  . The exact rising phase is not well constrained by the data, but the 90% confidence lower limit to the rising slope is α2 ≳ 3.5. The rise starts at
  d and then peaks at
  d, followed by another decline of α3 = −1.27 ± 0.03. For the full corner plot, see Figure B.1. The reduced chi-squared value for this fit is χ2/d.o.f. = 164/77 = 2.13.
If we instead require that the initial decay slope α1 and the final decaying slope α3 are fixed to the same value, we find α1 = α3 = −1.22 ± 0.03. The fit and its residuals are shown in Figure B.2, and the full corner plot is shown in Figure B.3. This model provides a slightly poorer description of the multiband OIR data, as evident from the residuals in Figure B.2. This is due to the reduced flexibility of the model. The reduced chi-squared value for this fit is also slightly worse with χ2/d.o.f. = 201/76 = 2.58. We therefore favor the fit shown in Figure 2, in which α1 and α3 are allowed to differ.
We note that the R-band photometry obtained with the VLT at 68 and 94 d (Section 2.4) after the EP trigger appears to be consistent with a flat evolution. We caution that this may be due to variable seeing affecting the photometry at 68 d. In particular, the R-band measurement at 68 d was obtained under poor seeing (full width at half maximum of ∼1.7″), whereas all other VLT data were obtained under better conditions, with seeing in the range 0.5 − 0.9″. An added uncertainty is the lack of information of the underlying host-galaxy contribution. An underlying host galaxy at z = 0.748 is required by the emission lines identified in long-slit optical spectroscopy (see Shu et al. 2025). The underlying host galaxy contribution to the measured flux would lead to an underestimation of the steepness of the transient’s flux decay rate. However, a longer baseline is required to conclusively determine the host galaxy contribution (which has an unknown brightness) and subtract it from the data.
If we assume that the flat evolution of the VLT R-band photometry between 68 and 94 d results from the underlying host galaxy (i.e., no longer probing the transient behavior), then the late-time slope α3 would be steeper. We therefore repeated the temporal fit outlined above after subtracting the inverse-variance-weighted mean of the final two data points from the light curve and excluding those data from the fit. This fit was performed in the r-band alone, as it is the only band where an apparent flattening is visible. The values of α1 and α2 remain largely unchanged by this subtraction, but it leads to a steeper decaying slope of the second segment with α3 =  . A late-time template image is required to properly subtract the host contribution and confirm any additional temporal breaks in the light curve, which will aid in the modeling and interpretation of the source.
We also model the Swift/XRT X-ray light curve (Table A.3) with a single power law, which yields a temporal index αX =  . This is consistent with the shallow X-ray decay (αX =
  ) at early times, as measured by Shu et al. (2025) using the full EP/FXT light curve. The measured X-ray decay (see also Figure 6) is consistent with the temporal indices of GRB X-ray plateaus (αX ≈ −0.7 to 0; e.g., Nousek et al. 2006; Bernardini et al. 2011), which are generally shallower than the expectations of a forward shock afterglow (Granot & Sari 2002). We further discuss the possibility that EP241021a exhibits an X-ray plateau in Sect. 4.4, as also discussed by Shu et al. (2025).
The Swift/XRT data clearly show a shallow decay, which is further supported by the refined EP/FXT light curve reported by Gianfagna et al. (2025), Shu et al. (2025) between 1 − 100 d. The EP/FXT light curve indicates that an X-ray rebrightening occurs simultaneously with the OIR bump (e.g., Shu et al. 2025). The refined EP/FXT X-ray light curve also shows a shallow plateau-like decay prior to the rebrightening, followed by a steepening at later times (see Shu et al. 2025 for further discussion). Nevertheless, this motivates deep, higher-cadence X-ray observations of future EP transients to better constrain their full multiwavelength behavior.
3.2. Spectral evolution
Figure 4 shows that EP241021a displays a consistent red color throughout its entire evolution (see also Figure 2). The photometry has been corrected for Galactic extinction, assuming E(B − V) = 0.045 mag (Schlafly & Finkbeiner 2011). We fit the r − z and r − J colors as a function of time with constant values (as shown in Figure 4), deriving r − z = 0.48 ± 0.03 and r − J = 0.81 ± 0.03 mag, with a χ2/d.o.f. = 2.20 for 15 degrees of freedom and χ2/d.o.f. = 1.92 for 16 degrees of freedom, respectively. Upper limits were excluded from the fit, as their large uncertainties do not constrain the color. There is a marginal deviation from this value in a small number of data points (Figure 4), but this is due to the large photometric errors at these phases that are caused by low S/N detections.
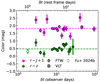 |
Fig. 4. Evolution of the r − z and r − J colors of EP241021a. The earliest color information was provided in the GCN circular by Fu et al. (2024a), while all other datapoints are derived from our FTW observations (Section 2.2). |
The full OIR dataset was modeled using Equation (1) and the methods outlined in Section 3.1. In Equation (1), we adopt a single power law of νβ for the source SED. The photometry was corrected for Galactic extinction E(B − V) = 0.045 mag (Schlafly & Finkbeiner 2011) prior to any fitting. We do not include additional dust intrinsic to the host galaxy. Using this fitting method, we find an OIR spectral index of βOIR =  (dashed lines in Figure 5). The posterior for the full fit, including the spectral index, is shown in Figure B.1. This provides a consistent description of the optical color (Figure 4) throughout the evolution of the transient.
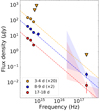 |
Fig. 5. Multi-epoch SED of EP241021a from X-ray to NIR frequencies, using Swift/XRT and FTW data. The three epochs correspond to pre-peak, peak, and post-peak SEDs. The uncertainty on the X-ray spectral index (νβ) is shown as a shaded region, with the median indicated by a dotted line. The dashed lines connecting the X-ray and OIR data use the best-fitting OIR spectral index, βOIR = −1.09. The X-ray data are consistent with the extrapolation of the OIR spectral index. |
We find that extrapolating the OIR spectral index to X-ray frequencies is consistent with the near-simultaneous X-ray data from Swift/XRT. Figure 5 shows the near-simultaneous broadband spectral energy distribution (from X-ray to NIR) across multiple epochs (observer-frame times of ∼3, 8, and 17 d). For Figure 5, the OIR data were shifted to the mid-time of the X-ray observations (Table A.3) using the best-fit OIR temporal fit (Equation (1)), as shown in Figure 2 (see Section 3.1 for details). While the Swift/XRT data have large error bars and a poorly constrained X-ray photon index (Γ = β − 1 ≈  ), we note that an analysis of the full EP/FXT dataset between 1.5 and 8.2 days by Gianfagna et al. (2025) yields a refined X-ray photon index of Γ = 1.92 ± 0.22, which is consistent with our inferred OIR spectral index.
3.3. Absolute magnitude
In Figure 2 (right side, vertical axis), we also show the rest-frame absolute magnitudes of the OIR filters, assuming a redshift of z = 0.748. After correcting for Galactic extinction E(B − V) = 0.045 mag, we convert the observed apparent magnitude in each filter to their corresponding rest-frame bandpasses (e.g., observer frame r-band to rest frame r-band). Assuming a power-law spectrum, Fν ∝ νβ (Section 3.2), the K-correction is given by Fν ∝ (1 + z)−β − 1, which for β = −1.08 corresponds to a minor correction to the absolute magnitude: k(z) = −2.5(−β − 1)log10(1 + z). For z = 0.748, the observer-frame r-band also approximately corresponds to the rest frame u-band. Using this conversion, the rebrightening episode of EP241021a peaks at a rest-frame absolute magnitude of Mr = −21.80 ± 0.11 mag in r-band, measured at 8.6 d in the observer frame (4.9 d in the rest frame). We account for errors in the inferred spectral index (Section 3.2). As the transient is already fading in the earliest observations (Figure 2), it is possible that the onset of the earlier emission episode is significantly more luminous.
4. Discussion
4.1. The multiwavelength properties of EP241021a
We briefly summarize the results of our analysis in terms of the multiwavelength properties of EP241021a:
-
The prompt emission at soft X-ray wavelengths is consistent with the energetics of low-luminosity GRBs, while no associated gamma-ray detection was recorded (see Section 2.1 and Figure 6).
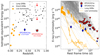
Fig. 6. Left: Isotropic-equivalent gamma-ray energies (1 − 10 000 keV; rest frame) of both short (black squares) and long duration (gray circles) GRBs versus redshift (Sakamoto et al. 2011; Lien et al. 2016; Atteia et al. 2017; O’Connor et al. 2024). A population of low-luminosity GRBs is shown with orange pentagons (e.g., Iwamoto et al. 1998; Galama et al. 1998, 1999; Malesani et al. 2004; Sakamoto et al. 2004; Soderberg et al. 2004a,b, 2006; Campana et al. 2006; Ofek et al. 2007; Starling et al. 2011; Cano et al. 2011; D’Elia et al. 2018; Izzo et al. 2019; HESS Collaboration 2021; Dichiara et al. 2022). The approximate energy release (0.5 − 4 keV; rest frame) of the initial EP detection of EP241021a is shown as a red star (Section 2.1; Hu et al. 2024). No bolometric correction has been applied due to the unknown spectral shape at > 4 keV; the presented energy is therefore a lower bound. Downward red arrows indicate the gamma-ray limits for EP241021a from Konus-Wind for gamma-ray emission durations between 3 s (bottom arrow) and 100 s (top arrow). The 1 − 10 000 keV energy release of EP241021a is bounded by these values. For comparison, EP240414a is shown as a blue diamond (0.5 − 4 keV; Sun et al. 2025). Right: Rest-frame X-ray light curves (0.3 − 10 keV) of Swift long GRBs (gray; duration > 2 s) and low-luminosity GRBs (orange; GRBs 060218, 100316D, 171205A, and 190829A) compared with X-ray light curves of EP241021a (taken from Shu et al. 2025) and EP240414a (taken from Sun et al. 2025; van Dalen et al. 2025).
-
The OIR light curve begins to rebrighten after approximately 3.2 days (rest frame) and peaks at approximately 4.5 days (rest frame), as discussed in Section 3.1 and illustrated in Figure 2.
-
The source exhibits a consistent red color (r − J = (0.81 ± 0.03) mag; Section 3.2), indicative of nonthermal emission (see Figures 4 and 5).
-
The presence of luminous X-ray and radio emission strengthens the evidence for a significant nonthermal component (e.g., Yadav et al. 2025; Gianfagna et al. 2025; Shu et al. 2025).
This multiwavelength behavior suggests that any scenario to explain EP241021a requires either multiple emission components, potentially due to multiple outflows, or a mechanism to produce a rebrightening phase, such as energy injection, long-lived central engine activity, a refreshed shock, or a reverse shock (see Section 4.6 for further discussion). In the next section, we explore the possible relation to EP240414a, which exhibited similar multiwavelength behavior.
4.2. A new class of transients: Comparison to EP240414a
We summarize the properties of EP240414a (z = 0.401), a twin of EP241021a, based on the analyses reported in the literature (Srivastav et al. 2025; van Dalen et al. 2025; Bright et al. 2025; Sun et al. 2025):
-
The initial EP trigger is consistent with the energetics of low-luminosity GRBs (Figure 6), and the peak energy Ep is well constrained to the soft X-ray band (Sun et al. 2025). There was no gamma-ray detection of the prompt emission.
-
A redshift of z = 0.401 was adopted based on the association with a massive host galaxy at a large projected physical offset of ∼26 kpc (van Dalen et al. 2025; Srivastav et al. 2025).
-
The initially decaying OIR emission significantly rebrightened to Mr ≈ −21 mag after 2 d (rest frame). During this phase, the source displayed a red color (r − z = (0.4 ± 0.1) mag; Srivastav et al. 2025). A third optical emission component at late times was identified as a Type Ic-BL supernova (van Dalen et al. 2025).
-
A luminous radio counterpart revealed the presence of at least a mildly relativistic outflow with bulk Lorentz factor Γ > 1.6 (Bright et al. 2025).
The exact nature of EP240414a is debated in the literature, with several possible interpretations presented, including an afterglow origin (possibly a refreshed shock; Srivastav et al. 2025; Sun et al. 2025), or the combination of a cocoon and the interaction between supernova ejecta and circumstellar material (van Dalen et al. 2025). Zheng et al. (2025) support the jet-cocoon interaction scenario, but suggest that the delayed rebrightening is due to an off-axis jet. Hamidani et al. (2025) instead suggest that extended circumstellar material led to an almost failed breakout of the relativistic jet, leading it to be weakened and delayed.
Given the shared properties between EP240414a and EP241021a – including the lack of gamma-ray emission, multiple optical emission components, long-lived and rather flat X-ray light curve, and luminous, late-peaking radio emission – we consider it likely these two events have a similar nature. EP240414a is conclusively associated with the death of a massive star through the presence of a Type Ic-BL supernova (van Dalen et al. 2025); consequently, we only consider a massive star progenitor for EP241021a and do not explore other possible explanations (e.g., a relativistic jetted tidal disruption event). Over the same timescale (i.e., covering the peak of a Type Ic-BL GRB-SN; Iwamoto et al. 1998; Galama et al. 1998), EP241021a is nearly two magnitudes more luminous than a Type Ic-BL supernova, which likely precluded the identification of a supernova component (as in GRB 221009A and other similarly luminous afterglows; e.g., Srinivasaragavan et al. 2023). Additional EP transients have subsequently been linked to massive star explosions by identifying Type Ic-BL supernovae, e.g., EP250108a (Rastinejad et al. 2025; Eyles-Ferris et al. 2025; Srinivasaragavan et al. 2025b; Li et al. 2025b) and EP250304a (Izzo et al. 2025).
4.3. The prompt emission
The high-energy detection of EP241021a and the nonthermal X-ray to NIR SED are reminiscent of cosmological GRBs, the most commonly observed class of high-energy transients. We therefore compare the high-energy properties of EP241021a to those of typical GRBs. In Figure 6 (left panel), we show the approximate rest-frame isotropic-equivalent 0.5 − 4 keV energy released by EP241021a during the initial EP trigger (Section 2.1; Hu et al. 2024), compared to different classes of GRBs in the rest frame 1 − 10 000 keV band. A bolometric correction is required for EP241021a to place it in the same energy band as the GRBs (Figure 6). However, the spectral shape of EP241021a’s prompt emission is unknown beyond 4 keV due to the absence of gamma-ray detections. The non-detection of EP241021a by Konus-Wind in the 20 − 1500 keV band (Section 2.1) is easily explained if the peak energy Ep is low, as was the case for EP240414a (Sun et al. 2025). This is further supported by the lack of gamma-ray detection by Fermi/GBM in the 10 − 1000 keV band (see Figure 2 of Yadav et al. 2025). Comparing the reported photon indices based on power-law spectral fits to the EP/WXT triggers (Hu et al. 2024; Sun et al. 2025; Shu et al. 2025), EP241021a shows a substantially harder spectrum (Γ =  ; Shu et al. 2025) relative to EP240414a (Γ = −3.1 ± 0.8 at 1σ CL; Sun et al. 2025), which exhibited an extremely low peak energy of Ep < 1.3 keV (Sun et al. 2025) – an outlier for a gamma-ray burst.
By contrast, EP241021a does not require such a low peak energy to be consistent with the non-detection of prompt gamma-ray emission (see also O’Connor et al. 2025). Figure 6 shows the range of isotropic-equivalent energy constraints from Konus-Wind (≲1051 − 4 × 1052 erg; 20 − 1500 keV). Adopting the upper bound of this energy range does not provide a strong constraint on the peak energy. However, we find that for a typical long GRB spectrum (a Band function with a low-energy photon index of −1 and a high-energy photon index of −2.5) extrapolating the prompt EP trigger (0.5 − 4 keV) with a standard bolometric correction requires Ep ≲ 100 keV in order to not overproduce the lower bound of the Konus-Wind limits (1 − 10 000 keV) for the same spectral shape (see Section 2.1 for details).
This is a reasonable value for the peak energy and is consistent with values observed for many long GRBs and their placement on the Amati relation (e.g., Amati et al. 2002; Amati 2006). The Amati relation is a correlation between the rest frame isotropic-equivalent gamma-ray energy, Eγ, in the 1 − 10 000 keV bandpass, with the rest-frame spectral peak energy, Ep = Ep, obs(1 + z), where Ep, obs is the observed peak energy. Using the best-fit Amati relation from Amati (2006), Ep = 95(Eγ/1052 erg)0.49 keV, we estimate a limit on the rest-frame peak energy of Ep ≲ 30 keV and ≲190 keV assuming either Eγ ≲ 1051 erg or ≲4 × 1052 erg depending on the assumed prompt emission duration between 3 s and 100 s (see Section 2.1 for details). This corresponds to an observed peak energy in the range ≲ 20 to 110 keV. However, due to the limited availability of high-energy data, we cannot precisely determine whether the lack of gamma rays is due to the limited sensitivity of the available gamma-ray telescopes, a low peak energy Ep, or a low gamma-ray efficiency, potentially resulting from a low outflow Lorentz factor or slightly off-axis viewing angle (see, e.g., Beniamini & Nakar 2019; O’Connor et al. 2024, for a discussion).
We further note that the prompt emission spectrum of EP241021a, with photon index Γ =  ; Shu et al. 2025, is consistent with the expectations of nonthermal synchrotron radiation produced by GRBs (e.g., Rees & Meszaros 1992; Preece et al. 1998, 2002). The inferred photon index lies within the range of low-energy photon indices observed from cosmological GRBs. For example, a detailed analysis of the prompt emission spectral properties of 438 Fermi GRBs Nava et al. (2011) identified a range of low-energy photon indices ranging from −2 to 0, while Lien et al. (2016), using the Third Swift Burst Alert Telescope (BAT) Catalog, report a range between −2.5 to −0.5. This range of values was also identified in a comprehensive spectral analysis of GRBs (e.g., Preece et al. 2000, 2002) detected by the Burst and Transient Source Experiment (BATSE). These values are typical of theoretical predictions from the synchrotron shock model (e.g., Rees & Meszaros 1992; Preece et al. 1998, 2002), and deviate significantly from the expected exponential tail of thermal emission. The fundamental prediction of the synchrotron shock model is a power-law spectrum with low-energy photon indices ranging from dN/dE ∝ E−3/2 to E−2/3 (e.g., Preece et al. 1998), where E−2/3 is the synchrotron “line of death”. The inferred prompt emission spectrum of EP241021a lies within this range (within 1-sigma). We note that steeper values are observed for the high-energy photon index, ranging from −3 to −2, for energies higher than Ep (e.g., Nava et al. 2011). Therefore, the photon index of EP241021a is in agreement with either the low- or high-energy photon indices observed from GRBs, and significantly differs from thermal emission expectations, which predict either a rising spectral slope below the peak or the exponential decay of the Wean tail (see, e.g., Rybicki & Lightman 1979).
The general energetics of EP240414a and EP241021a (Sun et al. 2025; Shu et al. 2025) clearly lie within those of low-luminosity GRBs (e.g., Iwamoto et al. 1998; Galama et al. 1998, 1999; Malesani et al. 2004; Sakamoto et al. 2004; Soderberg et al. 2004a,b, 2006; Campana et al. 2006; Ofek et al. 2007; Starling et al. 2011; Cano et al. 2011; D’Elia et al. 2018; Izzo et al. 2019; HESS Collaboration 2021; Dichiara et al. 2022; Irwin & Hotokezaka 2025), which can be missed by Konus-Wind depending on the uncertain spectral shape of the prompt emission. However, the X-ray emission is more luminous and long-lived than observed in standard low-luminosity GRBs (Figure 6; right panel), for example GRB 171205A (D’Elia et al. 2018). Moreover, the optical light curve differs significantly from the typically supernova-dominated light curves of low-luminosity GRBs (e.g., Soderberg et al. 2006; Campana et al. 2006; Starling et al. 2011; Cano et al. 2011; D’Elia et al. 2018; Izzo et al. 2019).
4.4. The X-ray light curve
The long-lasting, shallow X-ray emission of both EP240414a (e.g., Sun et al. 2025; Zheng et al. 2025) and EP241021a (Figure 6; Yadav et al. 2025; Shu et al. 2025; Gianfagna et al. 2025) are reminiscent of the X-ray plateaus observed in GRBs (e.g., Zhang et al. 2006; Troja et al. 2007; Dainotti et al. 2008; Rowlinson et al. 2010). Here, we define an X-ray plateau as a decay shallower than t−3/4 (e.g., Nousek et al. 2006), which is challenging to reproduce in the relativistic standard fireball model of GRB afterglows (Sari et al. 1999; Wijers & Galama 1999; Granot & Sari 2002). Although the precise mechanism that produces X-ray plateaus remains debated, multiple possible interpretations exist. In general, preferred models invoke the injection of energy from a long-lived central engine (Zhang et al. 2006; Liang et al. 2006; Troja et al. 2007; Lyons et al. 2010; Rowlinson et al. 2010, 2013), although other interpretations exist (Shen & Matzner 2012; Beniamini & Mochkovitch 2017; Beniamini et al. 2020a; Dereli-Bégué et al. 2022). X-ray plateaus observed in GRBs often exhibit correlations between their luminosity and plateau end time (see, e.g., Dainotti et al. 2008; Tang et al. 2019; Xu et al. 2021).
While the sparse Swift/XRT light curve of EP241021a (Section 3.1 and Table A.3) displays a clearly shallow decay with αX
 , the refined EP/FXT light curve (Gianfagna et al. 2025; Shu et al. 2025) further supports the long-lived shallow phase of the X-ray light curve. Shu et al. (2025) report a shallow decay of αX =
  extending out to
  d (rest frame). Although the exact mechanism driving the plateau is unclear, its behavior can be interpreted within the context of the typical GRB X-ray plateau correlations. We find that the observed X-ray plateaus of EP240414a and EP241021a are consistent with an extension of the typical rest-frame GRB X-ray plateau correlations between luminosity and duration (Figure 7; e.g., Dainotti et al. 2008; Tang et al. 2019; Xu et al. 2021), supporting their interpretation in the context of GRBs. The allowed range of X-ray plateau luminosity and duration for both events are represented as shaded regions in (Figure 7). These shaded regions are consistent with extrapolating the observed behavior of GRBs to lower luminosities and longer durations, at the same level of scatter as the GRB plateaus in the more well-populated region of parameter space. We refer to Shu et al. (2025) for an alternative interpretation5. These are among the longest plateaus detected from GRB-like outflows (e.g., Dainotti et al. 2008; Tang et al. 2019; Xu et al. 2021). This motivates further late-time observations (e.g., with Chandra and XMM-Newton) of EP sources, alongside improved early-time X-ray sampling by Swift and EP.
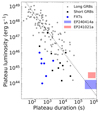 |
Fig. 7. Rest-frame X-ray plateau duration and luminosity for GRBs (Tang et al. 2019; Xu et al. 2021) and FXTs (Quirola-Vásquez et al. 2024) compared to EP240414a (blue shaded region; Sun et al. 2025; van Dalen et al. 2025) and EP241021a (red shaded region; Shu et al. 2025). The dotted line illustrates the extension of the GRB plateau correlation and is shown as a visual guide. |
4.5. Constraints on the initial Lorentz factor
4.5.1. Lorentz factor limits from the prompt emission
We find that the prompt emission spectrum observed by EP is nonthermal (see Section 4.3) based on the inferred photon index of Γ =  for the EP trigger (Hu et al. 2024; Shu et al. 2025). Producing a nonthermal, likely synchrotron, spectrum requires that energy is dissipated at a radius that is at least as large as the photosphere of the outflow (e.g., Goodman 1986; Thompson 1994). Therefore, the emission must occur at a low optical depth, τ ≲ 1. Based on the EP trigger, the minimum energy release is 3 × 1049 erg (0.5 − 4 keV) over the tdur ∼ 100 s trigger (Hu et al. 2024). The energy release is potentially much higher in larger energy bands. In addition, the true isotropic kinetic energy, Ekin, of the outflow is likely much larger when accounting for radiation efficiency, and probably exceeds Ekin ≳ 1050 erg. If the source is non-relativistic, then Ekin = Ekin, true ∼ Mv2/2, and the radius as a function of time for a given outflow velocity, v, is given by R ∼ vt. The optical depth of the outflow to Thomson scattering is then τ ∼ 2κEkin/(v4tdur2), where κ is the opacity. As the optical depth decreases rapidly with an increase in velocity, we conservatively assume a non-relativistic outflow with v ∼ 0.75c, (such that Γ0 < 1.5 and relativistic effects can be neglected). This leads to an extremely high optical depth on the order of hundreds. This would produce a thermal spectrum in sharp contrast to the observed prompt X-ray spectrum.
The optical depth can be reduced by assuming a higher velocity outflow. Expanding this calculation to the transrelativistic regime, the optical depth is given by
 (2)
(2)
where E50 = E/(1050 erg) is the isotropic-equivalent energy and tdur, 2 = tdur/(100 s) is the prompt emission duration. Requiring τ < 1, we find an initial bulk Lorentz factor of Γ0 ≳ 4. If the isotropic-equivalent energy were higher, an even larger Lorentz factor would be required. Although we cannot rule out efficient dissipation in a mildly optically thick regime with τ of a few, these calculations support the presence of at least a mildly relativistic outflow producing the prompt X-ray trigger of EP241021a. This is consistent with inferences for the Lorentz factor from analyses of the radio dataset (Yadav et al. 2025; Shu et al. 2025), which similarly find Γ0 ≳ 3 − 4.
4.5.2. Lorentz factor limits from jet deceleration
Assuming the multiwavelength emission from EP241021a is related to the interaction of a relativistic jet with its surrounding environment, we can constrain the initial bulk Lorentz factor of the outflow. For an on-axis observer, the afterglow emission is expected to decline once the jet has decelerated (see, e.g., O’Connor et al. 2020; O’Connor et al. 2024, for a discussion of the impact of the viewing angle). Therefore, based on the declining optical light curve starting at 1.14 d (0.65 d in the rest frame; Zheng et al. 2024b), we can set a lower limit on the initial bulk Lorentz factor Γ0 of material at the jet core. A relativistic jet propagating into an external environment ρ(r) ∝ r−k, where k = 0 represents a uniform-density environment and k = 2 corresponds to a stellar wind environment, begins to decelerate after a dynamical timescale tdec given by (Sari & Piran 1999; Molinari et al. 2007; Ghisellini et al. 2010; Ghirlanda et al. 2012; Nava et al. 2013; Nappo et al. 2014; Ghirlanda et al. 2018):
 (3)
(3)
where Γ0 is the initial bulk Lorentz factor at the jet’s core, Ekin is the kinetic energy, A = mpn0R0k, n0 is the density, mp is the proton mass, and c is the speed of light. Equation (3) simplifies to
![Mathematical equation: $$ \begin{aligned} \frac{t_{\rm dec}}{1+z} \lesssim \left\{ \begin{array}{ll} 0.68\, \Gamma _{0,1}^{-8/3}\,E_{\mathrm{kin},52}^{1/3}\,n^{-1/3} \; \mathrm{d}&k=0, \\ [2mm] 0.76\, \Gamma _{0,1}^{-4}\,E_{\mathrm{kin},52}\,A_{*,-1}^{-1} \; \mathrm{d}&k=2, \end{array} \right. \end{aligned} $$](/articles/aa/full_html/2025/09/aa54626-25/aa54626-25-eq22.gif) (4)
(4)
where Ekin, 52 = Ekin/(1052 erg), Γ0, 1 = Γ0/10, and A* = n0R02/(3 × 1035 cm−1) with R0 = 1018 cm, such that A*, −1 = A*/0.1. The constraint on the Lorentz factor is degenerate with both the kinetic energy of the blast wave and the density of the surrounding environment. Assuming a lower kinetic energy of Ekin = 1051 erg with A* = 1 and n = 1 cm−3, using Equation (4), we require Γ0 ≳ 3.5 (7.5) for a wind environment and uniform-density environment, respectively, in order for the jet to decelerate before the first optical observations. Based on this calculation, we conclude that the outflow must be at least mildly relativistic. This conclusion holds over a broad range of kinetic energies between Ekin = 1050 − 53 erg and densities A* < 10 and n < 10 cm−3. Under these conditions, the Lorentz factor required to satisfy this condition is always Γ0 ≳ 1.5 in a wind environment and Γ0 ≳4 in a uniform-density environment. Lower values for the surrounding density or larger energies require significantly larger Lorentz factors than these quoted values, which are the requirements for the minimum quoted energy (Ekin = 1050 erg) and the maximum quoted density (e.g., n < 10 cm−3). It is important to note that there are no robust constraints on the exact start time of the jet’s deceleration, and, as such, an extremely early deceleration (requiring higher Lorentz factors), typical of cosmological GRBs (e.g., Ghirlanda et al. 2018), cannot be excluded.
4.6. Possible origins of EP241021a
4.6.1. A rare supernova
Motivated by the similarity between the absolute magnitude of the second bump and those of superluminous supernovae (SLSNe), we used the Modular Open Source Fitter for Transients (MOSFiT; Nicholl et al. 2017; Guillochon et al. 2018) to fit the rebrightening phase (> 6 d; observer frame) of EP241021a with supernova-like models. None of the five models (see Appendix C for details) reproduced the light curve shape (Figure 8), particularly the rapid evolution and early decay.
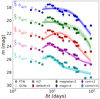 |
Fig. 8. Comparison between supernova models and the observed r-band optical light curve. The best-fits to the second component are shown for a range of MOSFiT models (default, magnetar, magni, csm, and csmni; see Section 4.6.1). Fits to the other filters (z and J) are either poor, or require large amounts of dust and extreme absolute magnitudes. |
These models rely on thermal emission, which requires significant dust to match EP241021a’s spectrum (Fν ∝ ν−1; Figure 5). While the circumstellar material interaction models (csmni and csm; Appendix C) roughly reproduce the post-peak behavior, they require extreme extinction (intrinsic AV, z ≳ 1.5 mag), implying unphysically high luminosities (≲ − 23.5 to −24.5 mag), beyond those observed in known SLSNe (e.g., Gomez et al. 2024).
Additional evidence against a SLSN origin includes EP241021a’s rapid evolution, red color, and luminous nonthermal radio emission (∼1031 erg cm−2 s−1 Hz−1; Yadav et al. 2025; Gianfagna et al. 2025; Shu et al. 2025; Srinivasaragavan et al., in prep.), which is several orders of magnitude above limits from known SLSNe (e.g., Coppejans et al. 2018; Eftekhari et al. 2019).
4.6.2. An off-axis structured jet
Beniamini et al. (2020a,2022) demonstrated that double-peaked afterglow light curves can be produced by a combination of line-of-sight material (producing the first peak) and emission from the jet core (producing the second peak). The major factor dictating whether an observer views a single- or double-peaked light curve is the lowest latitude of the jet, θ*, from which material is initially beamed towards the observer (θ*Γ(θ*) = 1; see discussions in Beniamini et al. 2020a, 2022 and Figure 8 of Beniamini et al. 2022). If θobs > θ*, the observer receives emission from progressively smaller angles until finally the core is observed, resulting in a single-peaked light curve. In contrast, when θobs < θ*, a double-peaked light curve can occur. Initially, the observer sees material far away from the core, which decelerates before emission from the core becomes visible (due to relativistic beaming). This leads to a first peak at approximately tdec(θobs) (see, e.g., O’Connor et al. 2024). The secondary peak occurs once the core is de-beamed to the observer, and is the more standard off-axis GRB peak discussed in the literature.
The relative significance of the second peak is dictated by the slope of the structured jet, characterized by E(θ) ∝ θ−a. Steeper jets and a uniform-density environment serve to substantially pronounce the second peak (see Figure 11 of Beniamini et al. 2022). Although this scenario may reproduce the timescale and flux ratio of the double-peaked OIR light curve of EP241021a, the observed rise to the second peak is too steep to naturally fit with this interpretation. We therefore disfavor a standard forward shock from an off-axis structured jet as the sole mechanism for producing both the early and late OIR behavior observed in EP241021a. If the rebrightening arises from an off-axis jet, the initial component would require a different emission mechanism (e.g., Zheng et al. 2025; Gianfagna et al. 2025).
An alternative possibility is that the rebrightening results from a reverse shock in off-axis material within a shallow structured jet (e.g., O’Connor et al. 2023; Gill & Granot 2023; Zhang et al. 2024). This does not necessarily require an off-axis viewing angle for the observer. Material at an off-axis angle would be moving with lower Lorentz factors and would also be delayed with regard to photons reaching the observer (due to relativistic beaming). This may offer a natural explanation for the delayed brightening seen in EP240414a and EP241021a. Abdikamalov & Beniamini (2025) recently conducted a comprehensive investigation of the possible light curve behaviors of reverse and forward shock emission in steep off-axis jets. They identified a variety of possible double-peaked light curve profiles, due to de-beamed emission from the reverse shock. Future work will extend these considerations to shallow structured jets and may reveal whether the observed behavior of EP241021a arises from reverse shock emission at an off-axis angle.
4.6.3. A refreshed shock
Over the past two decades, observations of GRBs have revealed a variety of peculiar and unexpected late-time behaviors. These include long-lived X-ray (e.g., Zhang et al. 2006; Troja et al. 2007) and optical (Panaitescu & Vestrand 2011; Knust et al. 2017) plateaus, late-time X-ray (Burrows et al. 2005b; Curran et al. 2008; Margutti et al. 2011; Bernardini et al. 2011) and optical (Swenson et al. 2013; Kumar et al. 2022) flares, and rapid episodes of rebrightening (e.g., Covino et al. 2008; Melandri et al. 2014; Dichiara et al. 2022; Moss et al. 2023). In many cases, these phenomena have been attributed to long-lived central engine activity (Burrows et al. 2005b; Zhang et al. 2006; Curran et al. 2008; Margutti et al. 2011), although other explanations are also plausible (Panaitescu 2008; Beniamini & Kumar 2016; Beniamini & Mochkovitch 2017; Lamberts & Daigne 2018; Ayache et al. 2020; Duque et al. 2022).
Late-time rebrightening is often attributed to refreshed shocks (Rees & Mészáros 1998; Sari & Mészáros 2000; Kumar & Panaitescu 2000; Jóhannesson et al. 2006), as observed in the afterglows of GRBs 030329 (Granot et al. 2003; Moss et al. 2023), 071010A (Covino et al. 2008), and 120326A (Melandri et al. 2014), among others, although in some cases a reverse shock is also possible (e.g., Dichiara et al. 2022). We note that extreme rebrightening episodes have also been observed in X-ray flashes (XRFs) such as XRF 050416a (Soderberg et al. 2007) at approximately 25 days (rest frame), which may also be due to a refreshed shock. In the standard refreshed shock model (Sari & Mészáros 2000; Kumar & Panaitescu 2000), promptly launched and rapid (Γ0 ≳ 100) material decelerates as it sweeps up circumburst material in an external shock at the front of the outflow. Eventually, it slows sufficiently for an initially less relativistic shell (Γ0 ≲ 10 − 20) to catch up and merge into a single blast wave, producing a brightness increase related to the energy added to the shock.
However, the rebrightening observed in EP241021a occurs at significantly later times (∼6.5 × 10⁵ s; observer frame) and is not easily connected to the behavior observed in on-axis cosmological GRBs, especially in terms of the relative significance of the rebrightening (i.e., by more than a magnitude). The time of the rebrightening can be related to the time of the shell collision when Γf(tcoll) =Γ0, s/2, which, in a uniform-density environment, occurs at (Moss et al. 2023):
 (5)
(5)
This timescale occurs for Γs ≈ 6 if the isotropic-equivalent kinetic energy is ∼1053 erg, which is likely at the extreme end of the possible values. If, instead, we consider a lower energy of ∼ 1051 erg with fixed density n = 1 cm−3, the Lorentz factor of the slower-moving material is then Γs ≈ 3, due to the weak dependence on energy in eqn:tcoll. Instead, in a wind environment, where tcoll ∝ (Ekin/A*)Γs−4 (Moss et al. 2023), we find Γs ≈ 7 (2) for Ekin ∼ 1053 (1051) erg. Regardless, in either case, the trailing ejecta must be at least mildly relativistic, which requires that the initial outflow is also relativistic.
The rebrightening timescale of EP241021a is consistent with Δtcoll/tcoll ≲ 0.3, similar to the observations of GRB 030329 (Granot et al. 2003; Moss et al. 2023). To a good approximation, the rise time corresponds to the reverse shock (RS) crossing time (Sari & Piran 1995), which is determined by the ratio of Lorentz factors (e.g, Moss et al. 2023), such that Δtcoll/tcoll ≈ ΔΓs/Γs (up to order unity corrections), where ΔΓs is the difference in Lorentz factors across the slower moving ejecta shell. We do not consider explanations such as density enhancement (e.g., Ramirez-Ruiz et al. 2001; Dai & Lu 2002; Nakar et al. 2003; Nakar & Granot 2007; van Eerten et al. 2009), a complex density profile (potentially due to the progenitor star’s mass loss history), or long-lived central engine activity, because none of these scenarios can easily reproduce the variability timescale (Δt/t ≲ 0.3) and extremely steep rise required by the rebrightening of the OIR afterglow (steeper than t3.5 at 90% CL; see Section 3.1).
The OIR temporal and spectral indices (Section 3.1 and Section 3.2) are capable of matching standard afterglow closure relations for both the uniform-density and the wind environment (Granot & Sari 2002). In a wind environment, which is expected for a massive star progenitor, the X-ray, optical, and NIR data would be above the cooling frequency (νc < ν), such that the temporal index and spectral index are α = (2 − 3p)/4 = −1.15 and β = −p/2 = −1.10 for p = 2.2 (Granot & Sari 2002). These indices are consistent with the values inferred in Section 3.1 and Section 3.2. We note that for emission above the cooling frequency, the closure relation is unchanged between a uniform-density and a wind environment. An additional possibility for a uniform-density environment is a steep value of p ≈ 3, such that β = (1 − p)/2 = −1 and α = 3(1 − p)/4 = −1.5. While the temporal slope has a better match for p ≈ 2.5, it is less consistent with the observed spectral index. In either scenario, the radio data lie below the injection frequency, νR < νm < νc (Yadav et al. 2025; Gianfagna et al. 2025; Shu et al. 2025; Srinivasaragavan et al., in prep.).
The refreshed shock interpretation naturally explains the steep rise observed at OIR wavelengths (Figure 2), as well as the flat appearance of the poorly sampled Swift/XRT X-ray light curve (Figure 6, right panel). We note that a refined EP/FXT light curve presented by Gianfagna et al. (2025), Shu et al. (2025) shows an X-ray bump that is simultaneous with the optical rebrightening. This is consistent with a refreshed shock interpretation, which should also affect the X-ray emission. In this scenario where the X-ray and optical behavior is linked to the same emission mechanism or outflow, the observed X-ray light curve is not a true plateau (Figure 6). However, Shu et al. (2025) note that the X-ray light curve has a plateau-like slope (αX =  ) out to
  d (rest frame), which we use in Figure 7. We also note that the radio light curves (Yadav et al. 2025; Gianfagna et al. 2025; Shu et al. 2025) are not sampled at earlier times, and all radio detections occur after the rebrightening phase, so a similar radio rebrightening is unconstrained. A refreshed relativistic shock wave also produces a nonthermal spectrum that provides a better description of the data than circumstellar medium interaction with non-relativistic supernova ejecta, which is commonly thought to produce a blackbody-like spectrum that is not observed (see Figure 5 and Sect. 4.6.1).
As our data do not show a clear jet break out to late times, we can set a constraint on the opening angle of the jet. We conservatively assume that the jet-break occurs after tj ≳ 30 d in the observer frame. Assuming an on-axis jet, the jet’s half-opening angle is larger than given by (Sari et al. 1999; Rhoads 1999; Frail et al. 2001; Chevalier & Li 2000; Bloom et al. 2003):
![Mathematical equation: $$ \begin{aligned} \theta _{\rm c} = \left\{ \begin{array}{ll} 0.2\,\mathrm{rad}\,\Bigg (\dfrac{t_{\rm j}}{30\,\mathrm{d}}\Bigg )^{3/8} \Bigg (\dfrac{E_{\rm kin}}{10^{52}\,\mathrm{erg}}\Bigg )^{-3/8} \Bigg (\dfrac{n}{10^{-2}\,\mathrm{cm}^{-3}}\Bigg )^{3/8},&k=0, \\ [4mm] 0.13\,\mathrm{rad}\,\Bigg (\dfrac{t_{\rm j}}{30\,\mathrm{d}}\Bigg )^{1/4} \Bigg (\dfrac{E_{\rm kin}}{10^{52}\,\mathrm{erg}}\Bigg )^{-1/4} \Bigg (\dfrac{A_*}{10^{-2}}\Bigg )^{1/4},&k=2. \end{array} \right., \end{aligned} $$](/articles/aa/full_html/2025/09/aa54626-25/aa54626-25-eq26.gif) (6)
(6)
where we have already applied the redshift corrections using z = 0.748. These half-opening angles are relatively large for a GRB jet (which is not unexpected given the lack of a jet break to late times in EP241021a), especially for k = 0, where θc ≳ 10 deg, but they are not completely unprecedented (e.g., Frail et al. 2001; Wang et al. 2018; Rouco Escorial et al. 2023; O’Connor et al. 2023). However, different assumptions regarding the kinetic energy and density can slightly decrease this opening angle. We note that this is consistent with the inference of a wide-angled outflow by Yadav et al. (2025), Gianfagna et al. (2025), based on independent modeling of the broadband (X-ray to radio) dataset. As the trailing ejecta is likely more collimated than the initial outflow, a larger opening angle more readily favors the production of a rebrightening episode with Δtcoll/tcoll ≲ 0.3 (see Moss et al. 2023 for a discussion).
Similarly significant and rapid optical rebrightenings, with a change in magnitude of Δm ≳ 1 mag, have been found to occur in a handful of GRBs (e.g., Figure 4 of de Ugarte Postigo et al. 2018), generally within a day after trigger (in the rest frame). The rebrightening of EP241021a lies at the far end of this distribution of rebrightening times (see Table 4 of de Ugarte Postigo et al. 2018), but is similar to GRB 970508 (Pian et al. 1998). In Figure 9, we show a population of GRBs with extreme optical rebrightenings, based on the population of optical light curves compiled by Kann et al. (2006, 2010, 2011, 2018) and reproduced from de Ugarte Postigo et al. (2018). The optical light curves shown in Figure 9 were compiled using the online catalog6 of Dainotti et al. (2024) and a public repository7 of Kann light curves (see Kann et al. 2006, 2010, 2011; Nicuesa Guelbenzu et al. 2012). These events support our interpretation of EP241021a in the context of GRBs.
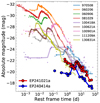 |
Fig. 9. Optical light curves (r-band) of GRBs exhibiting rapid and significant rebrightening (see 4.6.3). These are compared to EP240414a (Srivastav et al. 2025; van Dalen et al. 2025; Sun et al. 2025) and EP241021a (this work). The sample includes GRBs 970508 (Pian et al. 1998), 060206 (Woźniak et al. 2006), 060906 (Cenko et al. 2009), 081029 (Nardini et al. 2011), 100418A (Marshall et al. 2011; de Ugarte Postigo et al. 2018), 100621A (Greiner et al. 2013), 100901A (Gorbovskoy et al. 2012), 111209A (Kann et al. 2018), and 130831A (Cano et al. 2014). The solid lines show the data smoothed using a median filter. Reproduced from de Ugarte Postigo et al. (2018). |
Rapid afterglow rebrightening episodes, such as those shown in Figure 9, are generally interpreted as continued energy injection from the central engine (e.g., Marshall et al. 2011; Moin et al. 2013; Laskar et al. 2015), although other possible interpretations exist and there is no strong consensus regarding the exact mechanism. The continuous refreshing of the forward shock by ejecta with a range of Lorentz factors8 (Zhang et al. 2006; Rees & Mészáros 1998) is an alternative possibility (for further discussion see, e.g., Marshall et al. 2011; Moin et al. 2013). Other potential explanations proposed in the literature include a reverse shock (e.g., Kobayashi & Zhang 2003; Covino et al. 2010), a double jet (e.g., Kann et al. 2018), or an off-axis viewing angle (e.g., Marshall et al. 2011; Greiner et al. 2013).
As shown in Figure 9, the rebrightening of EP241021a lies at the extreme end of GRB optical luminosities at a similar rest frame time. The rebrightening phase is comparable to that of the brightest GRB afterglows, including GRB 221009A, the most energetic observed to date (e.g., O’Connor et al. 2023; Laskar et al. 2023). Such extreme rebrightening behavior (Figure 9) would be hard to miss in past GRBs, implying that EP240414a and EP241021a may possess unique central engine properties. These may result from either a failed or marginally successful jet breakout, which could also explain the absence of gamma-rays. As EP240414a and EP241021a are clearly distinct from the majority of GRBs (though potentially showing similar behavior to a small minority; Figure 9, de Ugarte Postigo et al. 2018), it is possible that other properties of their outflows are atypical. These may include their Lorentz factors being mildly relativistic and the presence of trailing ejecta with sufficient energy to produce a significant bump. Further exploration of the detectability of similar refreshed shocks in typical cosmological GRBs is deferred to future work and will aid in determining the uniqueness of this refreshed shock model for EP241021a.
5. Conclusions
We present the results of our multiwavelength follow-up campaign of EP241021a over the first 100 days of its evolution, including long-term monitoring with the FTW, VLT, and HET. Here, we summarize our main conclusions:
-
The nonthermal prompt soft X-ray emission detected by EP requires at least a mildly relativistic outflow, with a bulk Lorentz factor Γ ≳ 4. This interpretation is supported by multiple independent analyses of the comprehensive radio dataset, which likewise require a mildly relativistic outflow (see Yadav et al. 2025; Shu et al. 2025).
-
The rapid optical rebrightening (Figure 2) is challenging to explain with supernova-like models (Figure 8), but may be related to either refreshed shocks or a reverse shock from off-axis material. In either scenario, we favor an at least mildly relativistic outflow producing synchrotron radiation.
Future observations of similar events are required to build a sample, which will aid in determining the progenitor system, emission mechanisms, and diversity of their outflows. A refined X-ray dataset (i.e., higher cadence) and multiwavelength observations at < 1 d would provide stronger constraints on the available models, as well as the onset of the first component and its Lorentz factor.
We note that the L-T-E correlation (e.g., Tang et al. 2019; Xu et al. 2021) utilized by Shu et al. (2025) depends on the uncertain isotropic-equivalent gamma-ray energy (see Section 4.3). A higher isotopic energy (e.g. 1051 − 52 erg), which cannot be excluded by observations (Figure 6 and Sect. 2.1), leads EP241021 to be consistent with the GRB L-T-E correlation (Figure 8 of Tang et al. 2019). The correlation shown in Figure 7 is independent of this uncertainty.
We note that refreshing the forward shock via ejecta with a power-law distribution of Lorentz factors, Mej(Γ) ∝ Γ−s (e.g, Rees & Mészáros 1998), where Mej(Γ) is the ejecta mass for a given Lorentz factor, produces different behavior compared to a discrete injection of energy. For a detailed discussion, see Sari & Mészáros 2000. This work favors the discrete energy injection.
Acknowledgments
The authors thank the referee for their careful review and comments that improved the manuscript. B. O. acknowledges useful discussions with Dheeraj Pasham, Chris Irwin, Zorawar Wadiasingh, and Jonathan Granot. M. B. is supported by a Student Grant from the Wübben Stiftung Wissenschaft. B. O. is supported by the McWilliams Postdoctoral Fellowship at Carnegie Mellon University. P. B. is supported by a grant (no. 2020747) from the United States-Israel Binational Science Foundation (BSF), Jerusalem, Israel, by a grant (no. 1649/23) from the Israel Science Foundation and by a grant (no. 80NSSC 24K0770) from the NASA astrophysics theory program. M. M.’s research was supported by an appointment to the NASA Postdoctoral Program at the NASA Goddard Space Flight Center, administered by Oak Ridge Associated Universities under contract with NASA. E. T., Y.-H. Y., and M. Y. are supported by the European Research Council through the Consolidator grant BHianca (grant agreement ID 101002761). This paper contains data obtained at the Wendelstein Observatory of the Ludwig-Maximilians University Munich. Funded by the Deutsche Forschungsgemeinschaft (DFG, German Research Foundation) under Germany’s Excellence Strategy – EXC-2094 – 390783311. This research has made use of the XRT Data Analysis Software (XRTDAS) developed under the responsibility of the ASI Science Data Center (ASDC), Italy. This research has made use of data and/or software provided by the High Energy Astrophysics Science Archive Research Center (HEASARC), which is a service of the Astrophysics Science Division at NASA/GSFC. This paper contains data from observations obtained with the Hobby-Eberly Telescope (HET), which is a joint project of the University of Texas at Austin, the Pennsylvania State University, Ludwig-Maximillians-Universität München, and Georg-August Universität Göttingen. The HET is named in honor of its principal benefactors, William P. Hobby and Robert E. Eberly. We thank Cassie Crowe, Nathan McReynolds, Stephen Odewahn, Justen Pautzke, Amy Ray, Sergey Rostopchin, and Amy Westfall from the HET staff for obtaining the observations. We acknowledge the Texas Advanced Computing Center (TACC) at The University of Texas at Austin for providing high-performance computing, visualization, and storage resources that have contributed to the results reported within this paper. The Low Resolution Spectrograph 2 (LRS2) was developed and funded by the University of Texas at Austin, McDonald Observatory, Department of Astronomy, and Pennsylvania State University. We thank the Leibniz-Institut für Astrophysik Potsdam (AIP) and the Institut für Astrophysik Göttingen (IAG) for their contributions to the construction of the integral field units. This research has made use of the Astrophysics Data System, funded by NASA under Cooperative Agreement 80NSSC21M00561. This research has made use of adstex (https://github.com/yymao/adstex). This work made use of the catalog presented by Dainotti et al. (2024). This work made use of the Astro-COLIBRI platform (Reichherzer et al. 2021).
References
- Abdikamalov, E., & Beniamini, P. 2025, MNRAS, 539, 2707 [Google Scholar]
- Alp, D., & Larsson, J. 2020, ApJ, 896, 39 [NASA ADS] [CrossRef] [Google Scholar]
- Amati, L. 2006, MNRAS, 372, 233 [Google Scholar]
- Amati, L., Frontera, F., Tavani, M., et al. 2002, A&A, 390, 81 [NASA ADS] [CrossRef] [EDP Sciences] [Google Scholar]
- Appenzeller, I., Fricke, K., Fürtig, W., et al. 1998, The Messenger, 94, 1 [NASA ADS] [Google Scholar]
- Atteia, J. L., Heussaff, V., Dezalay, J. P., et al. 2017, ApJ, 837, 119 [Google Scholar]
- Ayache, E. H., van Eerten, H. J., & Daigne, F. 2020, MNRAS, 495, 2979 [Google Scholar]
- Band, D., Matteson, J., Ford, L., et al. 1993, ApJ, 413, 281 [Google Scholar]
- Beniamini, P., & Kumar, P. 2016, MNRAS, 457, L108 [Google Scholar]
- Beniamini, P., & Mochkovitch, R. 2017, A&A, 605, A60 [NASA ADS] [CrossRef] [EDP Sciences] [Google Scholar]
- Beniamini, P., & Nakar, E. 2019, MNRAS, 482, 5430 [NASA ADS] [CrossRef] [Google Scholar]
- Beniamini, P., Granot, J., & Gill, R. 2020a, MNRAS, 493, 3521 [NASA ADS] [CrossRef] [Google Scholar]
- Beniamini, P., Duque, R., Daigne, F., & Mochkovitch, R. 2020a, MNRAS, 492, 2847 [NASA ADS] [CrossRef] [Google Scholar]
- Beniamini, P., Gill, R., & Granot, J. 2022, MNRAS, 515, 555 [NASA ADS] [CrossRef] [Google Scholar]
- Bernardini, M. G., Margutti, R., Chincarini, G., Guidorzi, C., & Mao, J. 2011, A&A, 526, A27 [NASA ADS] [CrossRef] [EDP Sciences] [Google Scholar]
- Bertin, E. 2006, ASP Conf. Ser., 351, 112 [NASA ADS] [Google Scholar]
- Bertin, E. 2010, Astrophysics Source Code Library [record ascl:1010.068] [Google Scholar]
- Bertin, E., & Arnouts, S. 1996, A&AS, 117, 393 [NASA ADS] [CrossRef] [EDP Sciences] [Google Scholar]
- Bertin, E., Mellier, Y., Radovich, M., et al. 2002, ASP Conf. Ser., 281, 228 [Google Scholar]
- Bloom, J. S., Frail, D. A., & Kulkarni, S. R. 2003, ApJ, 594, 674 [NASA ADS] [CrossRef] [Google Scholar]
- Bochenek, A., & Perley, D. A. 2024a, GRB Coordinates Network, 37869, 1 [Google Scholar]
- Bochenek, A., & Perley, D. A. 2024b, GRB Coordinates Network, 38030, 1 [Google Scholar]
- Bradley, L., Sipőcz, B., Robitaille, T., et al. 2024, https://doi.org/10.5281/zenodo.13989456 [Google Scholar]
- Bright, J. S., Carotenuto, F., Fender, R., et al. 2025, ApJ, 981, 48 [Google Scholar]
- Burrows, D. N., Hill, J. E., Nousek, J. A., et al. 2005a, Space Sci. Rev., 120, 165 [Google Scholar]
- Burrows, D. N., Romano, P., Falcone, A., et al. 2005b, Science, 309, 1833 [NASA ADS] [CrossRef] [Google Scholar]
- Campana, S., Mangano, V., Blustin, A. J., et al. 2006, Nature, 442, 1008 [NASA ADS] [CrossRef] [Google Scholar]
- Cano, Z., Bersier, D., Guidorzi, C., et al. 2011, ApJ, 740, 41 [Google Scholar]
- Cano, Z., de Ugarte Postigo, A., Pozanenko, A., et al. 2014, A&A, 568, A19 [NASA ADS] [CrossRef] [EDP Sciences] [Google Scholar]
- Cappellaro, E., Mazzali, P. A., Benetti, S., et al. 1997, A&A, 328, 203 [NASA ADS] [Google Scholar]
- Cenko, S. B., Kelemen, J., Harrison, F. A., et al. 2009, ApJ, 693, 1484 [Google Scholar]
- Chambers, K. C., Magnier, E. A., & Metcalfe, N. 2016, ArXiv e-prints [arXiv:1612.05560] [Google Scholar]
- Chatzopoulos, E., Wheeler, J. C., Vinko, J., Horvath, Z. L., & Nagy, A. 2013, ApJ, 773, 76 [NASA ADS] [CrossRef] [Google Scholar]
- Chen, Z. H., Yan, L., Kangas, T., et al. 2023, ApJ, 943, 42 [NASA ADS] [CrossRef] [Google Scholar]
- Chevalier, R. A., & Li, Z.-Y. 2000, ApJ, 536, 195 [NASA ADS] [CrossRef] [Google Scholar]
- Chonis, T. S., Hill, G. J., Lee, H., Tuttle, S. E., & Vattiat, B. L. 2014, SPIE Conf. Ser., 9147, 91470A [Google Scholar]
- Chonis, T. S., Hill, G. J., Lee, H., et al. 2016, SPIE Conf. Ser., 9908, 99084C [NASA ADS] [Google Scholar]
- Coppejans, D. L., Margutti, R., Guidorzi, C., et al. 2018, ApJ, 856, 56 [NASA ADS] [CrossRef] [Google Scholar]
- Covino, S., D’Avanzo, P., Klotz, A., et al. 2008, MNRAS, 388, 347 [NASA ADS] [CrossRef] [Google Scholar]
- Covino, S., Campana, S., Conciatore, M. L., et al. 2010, A&A, 521, A53 [Google Scholar]
- Curran, P. A., Starling, R. L. C., O’Brien, P. T., et al. 2008, A&A, 487, 533 [NASA ADS] [CrossRef] [EDP Sciences] [Google Scholar]
- Dai, Z. G., & Lu, T. 2002, ApJ, 565, L87 [Google Scholar]
- Dainotti, M. G., Cardone, V. F., & Capozziello, S. 2008, MNRAS, 391, L79 [NASA ADS] [CrossRef] [Google Scholar]
- Dainotti, M. G., De Simone, B., Mohideen Malik, R. F., et al. 2024, MNRAS, 533, 4023 [NASA ADS] [CrossRef] [Google Scholar]
- de Ugarte Postigo, A., Thöne, C. C., Bensch, K., et al. 2018, A&A, 620, A190 [NASA ADS] [CrossRef] [EDP Sciences] [Google Scholar]
- D’Elia, V., Campana, S., D’Aì, A., et al. 2018, A&A, 619, A66 [NASA ADS] [CrossRef] [EDP Sciences] [Google Scholar]
- Dereli-Bégué, H., Pe’er, A., Ryde, F., et al. 2022, Nat. Commun., 13, 5611 [CrossRef] [Google Scholar]
- Dichiara, S., Troja, E., Lipunov, V., et al. 2022, MNRAS, 512, 2337 [Google Scholar]
- Duque, R., Beniamini, P., Daigne, F., & Mochkovitch, R. 2022, MNRAS, 513, 951 [CrossRef] [Google Scholar]
- Eftekhari, T., Berger, E., Margalit, B., et al. 2019, ApJ, 876, L10 [NASA ADS] [CrossRef] [Google Scholar]
- Eyles-Ferris, R. A. J., Jonker, P. G., Levan, A. J., et al. 2025, ApJ, 988, L14 [Google Scholar]
- Foreman-Mackey, D., Hogg, D. W., Lang, D., & Goodman, J. 2013, PASP, 125, 306 [Google Scholar]
- Fowler, A. M., & Gatley, I. 1990, ApJ, 353, L33 [Google Scholar]
- Frail, D. A., Kulkarni, S. R., Sari, R., et al. 2001, ApJ, 562, L55 [NASA ADS] [CrossRef] [Google Scholar]
- Freeburn, J., Cooke, J., Möller, A., et al. 2024a, MNRAS, 531, 4836 [Google Scholar]
- Freeburn, J., Andreoni, I., & Carney, J. 2024b, GRB Coordinates Network, 37942, 1 [Google Scholar]
- Fu, S. Y., Zhu, Z. P., An, J., et al. 2024a, GRB Coordinates Network, 37840, 1 [Google Scholar]
- Fu, S. Y., Tinyanont, S., Anutarawiramkul, R., et al. 2024b, GRB Coordinates Network, 37842, 1 [Google Scholar]
- Gaia Collaboration 2020, VizieR Online Data Catalog: I/350 [Google Scholar]
- Gaia Collaboration (Brown, A. G. A., et al.) 2021, A&A, 649, A1 [NASA ADS] [CrossRef] [EDP Sciences] [Google Scholar]
- Galama, T. J., Vreeswijk, P. M., van Paradijs, J., et al. 1998, Nature, 395, 670 [Google Scholar]
- Galama, T. J., Vreeswijk, P. M., van Paradijs, J., et al. 1999, A&AS, 138, 465 [NASA ADS] [CrossRef] [EDP Sciences] [Google Scholar]
- Gehrels, N., Chincarini, G., Giommi, P., et al. 2004, ApJ, 611, 1005 [Google Scholar]
- Ghirlanda, G., Ghisellini, G., Nava, L., et al. 2012, MNRAS, 422, 2553 [Google Scholar]
- Ghirlanda, G., Nappo, F., Ghisellini, G., et al. 2018, A&A, 609, A112 [NASA ADS] [CrossRef] [EDP Sciences] [Google Scholar]
- Ghisellini, G., Ghirlanda, G., Nava, L., & Celotti, A. 2010, MNRAS, 403, 926 [NASA ADS] [CrossRef] [Google Scholar]
- Gianfagna, G., Piro, L., Bruni, G., et al. 2025, A&A, submitted [arXiv:2505.05444] [Google Scholar]
- Gill, R., & Granot, J. 2023, MNRAS, 524, L78 [NASA ADS] [CrossRef] [Google Scholar]
- Gillanders, J. H., Rhodes, L., Srivastav, S., et al. 2024, ApJ, 969, L14 [NASA ADS] [CrossRef] [Google Scholar]
- Gomez, S., Berger, E., Nicholl, M., Blanchard, P. K., & Hosseinzadeh, G. 2022, ApJ, 941, 107 [NASA ADS] [CrossRef] [Google Scholar]
- Gomez, S., Nicholl, M., Berger, E., et al. 2024, MNRAS, 535, 471 [NASA ADS] [CrossRef] [Google Scholar]
- Goodman, J. 1986, ApJ, 308, L47 [NASA ADS] [CrossRef] [Google Scholar]
- Gorbovskoy, E. S., Lipunova, G. V., Lipunov, V. M., et al. 2012, MNRAS, 421, 1874 [NASA ADS] [CrossRef] [Google Scholar]
- Gössl, C. A., & Riffeser, A. 2002, A&A, 381, 1095 [NASA ADS] [CrossRef] [EDP Sciences] [Google Scholar]
- Granot, J., & Sari, R. 2002, ApJ, 568, 820 [NASA ADS] [CrossRef] [Google Scholar]
- Granot, J., Nakar, E., & Piran, T. 2003, Nature, 426, 138 [Google Scholar]
- Greiner, J., Krühler, T., Nardini, M., et al. 2013, A&A, 560, A70 [NASA ADS] [CrossRef] [EDP Sciences] [Google Scholar]
- Guillochon, J., Nicholl, M., Villar, V. A., et al. 2018, ApJS, 236, 6 [NASA ADS] [CrossRef] [Google Scholar]
- Hamidani, H., Sato, Y., Kashiyama, K., et al. 2025, ApJ, 986, L4 [Google Scholar]
- HESS Collaboration (Abdalla, H., et al.) 2021, Science, 372, 1081 [NASA ADS] [CrossRef] [Google Scholar]
- Hill, G. J., Lee, H., MacQueen, P. J., et al. 2021, AJ, 162, 298 [NASA ADS] [CrossRef] [Google Scholar]
- Hinton, S. R. 2016, J. Open Source Software, 1, 00045 [NASA ADS] [CrossRef] [Google Scholar]
- Ho, A. Y. Q., Perley, D. A., Yao, Y., et al. 2022, ApJ, 938, 85 [NASA ADS] [CrossRef] [Google Scholar]
- Hopp, U., Bender, R., Grupp, F., et al. 2014, SPIE Conf. Ser., 9145, 91452D [Google Scholar]
- Hu, J. W., Wang, Y., He, H., et al. 2024, GRB Coordinates Network, 37834, 1 [Google Scholar]
- Huang, Y. F., Dai, Z. G., & Lu, T. 2002, MNRAS, 332, 735 [NASA ADS] [CrossRef] [Google Scholar]
- Irwin, C. M., & Hotokezaka, K. 2025, MNRAS, 542, 1269 [Google Scholar]
- Iwamoto, K., Mazzali, P. A., Nomoto, K., et al. 1998, Nature, 395, 672 [Google Scholar]
- Izzo, L., de Ugarte Postigo, A., Maeda, K., et al. 2019, Nature, 565, 324 [Google Scholar]
- Izzo, L., Martin-Carrillo, A., Malesani, D. B., et al. 2025, GRB Coordinates Network, 39851, 1 [Google Scholar]
- Jiang, S. Q., Xu, D., van Hoof, A. P. C., et al. 2025, ApJ, 988, L34 [Google Scholar]
- Jóhannesson, G., Björnsson, G., & Gudmundsson, E. H. 2006, ApJ, 647, 1238 [Google Scholar]
- Kann, D. A., Klose, S., & Zeh, A. 2006, ApJ, 641, 993 [NASA ADS] [CrossRef] [Google Scholar]
- Kann, D. A., Klose, S., Zhang, B., et al. 2010, ApJ, 720, 1513 [Google Scholar]
- Kann, D. A., Klose, S., Zhang, B., et al. 2011, ApJ, 734, 96 [NASA ADS] [CrossRef] [Google Scholar]
- Kann, D. A., Schady, P., Olivares, E. F., et al. 2018, A&A, 617, A122 [NASA ADS] [CrossRef] [EDP Sciences] [Google Scholar]
- Klingler, N., Oates, S. R., Eyles-Ferris, R., & Swift-UVOT Team 2024, GRB Coordinates Network, 37990, 1 [Google Scholar]
- Kissler-Patig, M., Pirard, J. F., Casali, M., et al. 2008, A&A, 491, 941 [NASA ADS] [CrossRef] [EDP Sciences] [Google Scholar]
- Knust, F., Greiner, J., van Eerten, H. J., et al. 2017, A&A, 607, A84 [NASA ADS] [CrossRef] [EDP Sciences] [Google Scholar]
- Kobayashi, S., & Zhang, B. 2003, ApJ, 582, L75 [NASA ADS] [CrossRef] [Google Scholar]
- Svinkin, D., Frederiks, D., & Konus-Wind team 2024, GRB Coordinates Network, 38034, 1 [Google Scholar]
- Koposov, S., Speagle, J., Barbary, K., et al. 2024, https://doi.org/10.5281/zenodo.3348367 [Google Scholar]
- Kumar, P., & Panaitescu, A. 2000, ApJ, 541, L51 [NASA ADS] [CrossRef] [Google Scholar]
- Kumar, H., Gupta, R., Saraogi, D., et al. 2022, MNRAS, 513, 2777 [Google Scholar]
- Lamberts, A., & Daigne, F. 2018, MNRAS, 474, 2813 [Google Scholar]
- Lang-Bardl, F., Bender, R., Goessl, C., et al. 2016, SPIE Conf. Ser., 9908, 990844 [Google Scholar]
- Laskar, T., Berger, E., Margutti, R., et al. 2015, ApJ, 814, 1 [NASA ADS] [CrossRef] [Google Scholar]
- Laskar, T., Alexander, K. D., Margutti, R., et al. 2023, ApJ, 946, L23 [NASA ADS] [CrossRef] [Google Scholar]
- Levan, A. J., Jonker, P. G., Saccardi, A., et al. 2024, ArXiv e-prints [arXiv:2404.16350] [Google Scholar]
- Li, W. X., Sun, N. C., Maund, J., Wang, Y. N., & Wiersema, K. 2024a, GRB Coordinates Network, 37846, 1 [Google Scholar]
- Li, W. X., Xue, S. J., Andrews, M., et al. 2024b, GRB Coordinates Network, 37844, 1 [Google Scholar]
- Li, M. L., Ho, A. Y. Q., Ryan, G., et al. 2025a, ApJ, 985, 124 [Google Scholar]
- Li, W. X., Zhu, Z. P., Zou, X. Z., et al. 2025b, ArXiv e-prints [arXiv:2504.17034] [Google Scholar]
- Liang, E. W., Zhang, B., O’Brien, P. T., et al. 2006, ApJ, 646, 351 [NASA ADS] [CrossRef] [Google Scholar]
- Lien, A., Sakamoto, T., Barthelmy, S. D., et al. 2016, ApJ, 829, 7 [Google Scholar]
- Lindegren, L., Klioner, S. A., Hernández, J., et al. 2021, A&A, 649, A2 [EDP Sciences] [Google Scholar]
- Lipunov, V., Kornilov, V., Zhirkov, K., et al. 2022, MNRAS, 516, 4980 [NASA ADS] [CrossRef] [Google Scholar]
- Liu, Y., Sun, H., Xu, D., et al. 2025, Nat. Astron., 9, 564 [Google Scholar]
- Lyons, N., O’Brien, P. T., Zhang, B., et al. 2010, MNRAS, 402, 705 [NASA ADS] [CrossRef] [Google Scholar]
- Malesani, D., Tagliaferri, G., Chincarini, G., et al. 2004, ApJ, 609, L5 [Google Scholar]
- Margutti, R., Bernardini, G., Barniol Duran, R., et al. 2011, MNRAS, 410, 1064 [NASA ADS] [CrossRef] [Google Scholar]
- Marshall, F. E., Antonelli, L. A., Burrows, D. N., et al. 2011, ApJ, 727, 132 [NASA ADS] [CrossRef] [Google Scholar]
- Meegan, C., Lichti, G., Bhat, P. N., et al. 2009, ApJ, 702, 791 [Google Scholar]
- Melandri, A., Virgili, F. J., Guidorzi, C., et al. 2014, A&A, 572, A55 [NASA ADS] [CrossRef] [EDP Sciences] [Google Scholar]
- Moin, A., Chandra, P., Miller-Jones, J. C. A., et al. 2013, ApJ, 779, 105 [Google Scholar]
- Molinari, E., Vergani, S. D., Malesani, D., et al. 2007, A&A, 469, L13 [NASA ADS] [CrossRef] [EDP Sciences] [Google Scholar]
- Moss, M. J., Mochkovitch, R., Daigne, F., Beniamini, P., & Guiriec, S. 2023, MNRAS, 525, 5224 [Google Scholar]
- Nadyozhin, D. K. 1994, ApJS, 92, 527 [Google Scholar]
- Nakar, E., & Granot, J. 2007, MNRAS, 380, 1744 [Google Scholar]
- Nakar, E., Piran, T., & Granot, J. 2002, ApJ, 579, 699 [NASA ADS] [CrossRef] [Google Scholar]
- Nakar, E., Piran, T., & Granot, J. 2003, New Astron., 8, 495 [Google Scholar]
- Nappo, F., Ghisellini, G., Ghirlanda, G., et al. 2014, MNRAS, 445, 1625 [NASA ADS] [CrossRef] [Google Scholar]
- Nardini, M., Greiner, J., Krühler, T., et al. 2011, A&A, 531, A39 [NASA ADS] [CrossRef] [EDP Sciences] [Google Scholar]
- Nava, L., Ghirlanda, G., Ghisellini, G., & Celotti, A. 2011, A&A, 530, A21 [NASA ADS] [CrossRef] [EDP Sciences] [Google Scholar]
- Nava, L., Sironi, L., Ghisellini, G., Celotti, A., & Ghirlanda, G. 2013, MNRAS, 433, 2107 [NASA ADS] [CrossRef] [Google Scholar]
- Nicholl, M., Guillochon, J., & Berger, E. 2017, ApJ, 850, 55 [NASA ADS] [CrossRef] [Google Scholar]
- Nicholl, M., Blanchard, P. K., Berger, E., et al. 2020, Nat. Astron., 4, 893 [NASA ADS] [CrossRef] [Google Scholar]
- Nicuesa Guelbenzu, A., Klose, S., Greiner, J., et al. 2012, A&A, 548, A101 [NASA ADS] [CrossRef] [EDP Sciences] [Google Scholar]
- Nousek, J. A., Kouveliotou, C., Grupe, D., et al. 2006, ApJ, 642, 389 [Google Scholar]
- O’Connor, B., Beniamini, P., & Kouveliotou, C. 2020, MNRAS, 495, 4782 [CrossRef] [Google Scholar]
- O’Connor, B., Troja, E., Dichiara, S., et al. 2022, MNRAS, 515, 4890 [CrossRef] [Google Scholar]
- O’Connor, B., Troja, E., Ryan, G., et al. 2023, Sci. Adv., 9, eadi1405 [CrossRef] [Google Scholar]
- O’Connor, B., Beniamini, P., & Gill, R. 2024, MNRAS, 533, 1629 [Google Scholar]
- O’Connor, B., Pasham, D., Andreoni, I., et al. 2025, ApJ, 979, L30 [Google Scholar]
- Ofek, E. O., Cenko, S. B., Gal-Yam, A., et al. 2007, ApJ, 662, 1129 [Google Scholar]
- Panaitescu, A. 2008, MNRAS, 383, 1143 [Google Scholar]
- Panaitescu, A., & Vestrand, W. T. 2011, MNRAS, 414, 3537 [Google Scholar]
- Pérez-Fournon, I., Sun, N. C., Li, W., et al. 2024, GRB Coordinates Network, 37858, 1 [Google Scholar]
- Perley, D. A., Ho, A. Y. Q., Fausnaugh, M., et al. 2025, MNRAS, 537, 1 [NASA ADS] [Google Scholar]
- Pian, E., Fruchter, A. S., Bergeron, L. E., et al. 1998, ApJ, 492, L103 [Google Scholar]
- Planck Collaboration VI. 2020, A&A, 641, A6 [NASA ADS] [CrossRef] [EDP Sciences] [Google Scholar]
- Preece, R. D., Briggs, M. S., Mallozzi, R. S., et al. 1998, ApJ, 506, L23 [Google Scholar]
- Preece, R. D., Briggs, M. S., Mallozzi, R. S., et al. 2000, ApJS, 126, 19 [Google Scholar]
- Preece, R. D., Briggs, M. S., Giblin, T. W., et al. 2002, ApJ, 581, 1248 [Google Scholar]
- Pugliese, G., Xu, D., Izzo, L., et al. 2024, GRB Coordinates Network, 37852, 1 [Google Scholar]
- Quirola-Vásquez, J., Bauer, F. E., Jonker, P. G., et al. 2022, A&A, 663, A168 [NASA ADS] [CrossRef] [EDP Sciences] [Google Scholar]
- Quirola-Vásquez, J., Bauer, F. E., Jonker, P. G., et al. 2023, A&A, 675, A44 [NASA ADS] [CrossRef] [EDP Sciences] [Google Scholar]
- Quirola-Vásquez, J., Bauer, F. E., Jonker, P. G., et al. 2024, A&A, 683, A243 [NASA ADS] [CrossRef] [EDP Sciences] [Google Scholar]
- Quirola-Vasquez, J. A., Malesani, D. B., Levan, A. J., Bauer, F. E., & Jonker, P. G. 2024, GRB Coordinates Network, 37930, 1 [Google Scholar]
- Ramirez-Ruiz, E., Dray, L. M., Madau, P., & Tout, C. A. 2001, MNRAS, 327, 829 [Google Scholar]
- Ramsey, L. W., Adams, M. T., Barnes, T. G., et al. 1998, SPIE Conf. Ser., 3352, 34 [Google Scholar]
- Rastinejad, J. C., Levan, A. J., Jonker, P. G., et al. 2025, ApJ, 988, L13 [Google Scholar]
- Rees, M. J., & Meszaros, P. 1992, MNRAS, 258, 41 [Google Scholar]
- Rees, M. J., & Mészáros, P. 1998, ApJ, 496, L1 [NASA ADS] [CrossRef] [Google Scholar]
- Reichherzer, P., Schüssler, F., Lefranc, V., et al. 2021, ApJS, 256, 5 [NASA ADS] [CrossRef] [Google Scholar]
- Rhoads, J. E. 1999, ApJ, 525, 737 [Google Scholar]
- Rhoads, J. E. 2003, ApJ, 591, 1097 [Google Scholar]
- Ricci, R., Troja, E., Yang, Y.-H., et al. 2025, ApJ, 979, L28 [Google Scholar]
- Roming, P. W. A., Kennedy, T. E., Mason, K. O., et al. 2005, Space Sci. Rev., 120, 95 [Google Scholar]
- Ror, A. K., Gupta, A., Tripathi, T., Pandey, S. B., & Mishra, K. 2024, GRB Coordinates Network, 37845, 1 [Google Scholar]
- Rouco Escorial, A., Fong, W., Berger, E., et al. 2023, ApJ, 959, 13 [NASA ADS] [CrossRef] [Google Scholar]
- Rowlinson, A., O’Brien, P. T., Tanvir, N. R., et al. 2010, MNRAS, 409, 531 [NASA ADS] [CrossRef] [Google Scholar]
- Rowlinson, A., O’Brien, P. T., Metzger, B. D., Tanvir, N. R., & Levan, A. J. 2013, MNRAS, 430, 1061 [NASA ADS] [CrossRef] [Google Scholar]
- Rybicki, G. B., & Lightman, A. P. 1979, Radiative processes in astrophysics (New York, USA: Wiley-Interscience Publication) [Google Scholar]
- Sakamoto, T., Lamb, D. Q., Graziani, C., et al. 2004, ApJ, 602, 875 [CrossRef] [Google Scholar]
- Sakamoto, T., Barthelmy, S. D., Baumgartner, W. H., et al. 2011, ApJS, 195, 2 [Google Scholar]
- Sari, R., & Mészáros, P. 2000, ApJ, 535, L33 [NASA ADS] [CrossRef] [Google Scholar]
- Sari, R., & Piran, T. 1995, ApJ, 455, L143 [Google Scholar]
- Sari, R., & Piran, T. 1999, ApJ, 520, 641 [NASA ADS] [CrossRef] [Google Scholar]
- Sari, R., Piran, T., & Halpern, J. P. 1999, ApJ, 519, L17 [NASA ADS] [CrossRef] [Google Scholar]
- Schlafly, E. F., & Finkbeiner, D. P. 2011, ApJ, 737, 103 [Google Scholar]
- Schneider, B., & Adami, C. 2024a, GRB Coordinates Network, 38071, 1 [Google Scholar]
- Schneider, B., & Adami, C. 2024b, GRB Coordinates Network, 38022, 1 [Google Scholar]
- Shen, R., & Matzner, C. D. 2012, ApJ, 744, 36 [NASA ADS] [CrossRef] [Google Scholar]
- Shetrone, M., Cornell, M. E., Fowler, J. R., et al. 2007, PASP, 119, 556 [Google Scholar]
- Shu, X., Lei, Y., Haonan, Y., et al. 2025, ArXiv e-prints [arXiv:2505.07665] [Google Scholar]
- Skrutskie, M. F., Cutri, R. M., Stiening, R., et al. 2006, AJ, 131, 1163 [NASA ADS] [CrossRef] [Google Scholar]
- Soderberg, A. M., Kulkarni, S. R., Berger, E., et al. 2004a, ApJ, 606, 994 [CrossRef] [Google Scholar]
- Soderberg, A. M., Kulkarni, S. R., Berger, E., et al. 2004b, Nature, 430, 648 [NASA ADS] [CrossRef] [Google Scholar]
- Soderberg, A. M., Kulkarni, S. R., Nakar, E., et al. 2006, Nature, 442, 1014 [CrossRef] [Google Scholar]
- Soderberg, A. M., Nakar, E., Cenko, S. B., et al. 2007, ApJ, 661, 982 [Google Scholar]
- Speagle, J. S. 2020, MNRAS, 493, 3132 [Google Scholar]
- Srinivasaragavan, G. P., O’Connor, B., Cenko, S. B., et al. 2023, ApJ, 949, L39 [Google Scholar]
- Srinivasaragavan, G. P., Perley, D. A., Ho, A. Y. Q., et al. 2025a, MNRAS, 538, 351 [Google Scholar]
- Srinivasaragavan, G. P., Hamidani, H., Schroeder, G., et al. 2025b, ApJ, 988, L60 [Google Scholar]
- Srivastav, S., Chen, T. W., Gillanders, J. H., et al. 2025, ApJ, 978, L21 [Google Scholar]
- Starling, R. L. C., Wiersema, K., Levan, A. J., et al. 2011, MNRAS, 411, 2792 [NASA ADS] [CrossRef] [Google Scholar]
- Sun, H., Li, W. X., Liu, L. D., et al. 2025, Nat. Astron., 9, 1073 [Google Scholar]
- Suzuki, A., Nicholl, M., Moriya, T. J., & Takiwaki, T. 2021, ApJ, 908, 99 [NASA ADS] [CrossRef] [Google Scholar]
- Swenson, C. A., Roming, P. W. A., De Pasquale, M., & Oates, S. R. 2013, ApJ, 774, 2 [NASA ADS] [CrossRef] [Google Scholar]
- Tang, C.-H., Huang, Y.-F., Geng, J.-J., & Zhang, Z.-B. 2019, ApJS, 245, 1 [NASA ADS] [CrossRef] [Google Scholar]
- Thompson, C. 1994, MNRAS, 270, 480 [NASA ADS] [CrossRef] [Google Scholar]
- Troja, E., Cusumano, G., O’Brien, P. T., et al. 2007, ApJ, 665, 599 [NASA ADS] [CrossRef] [Google Scholar]
- van Dalen, J. N. D., Levan, A. J., Jonker, P. G., et al. 2025, ApJ, 982, L47 [Google Scholar]
- van Eerten, H. J., Meliani, Z., Wijers, R. A. M. J., & Keppens, R. 2009, MNRAS, 398, L63 [Google Scholar]
- Villar, V. A., Berger, E., Metzger, B. D., & Guillochon, J. 2017, ApJ, 849, 70 [NASA ADS] [CrossRef] [Google Scholar]
- Wang, X.-G., Zhang, B., Liang, E.-W., et al. 2018, ApJ, 859, 160 [NASA ADS] [CrossRef] [Google Scholar]
- Wijers, R. A. M. J., & Galama, T. J. 1999, ApJ, 523, 177 [Google Scholar]
- Willingale, R., Starling, R. L. C., Beardmore, A. P., Tanvir, N. R., & O’Brien, P. T. 2013, MNRAS, 431, 394 [Google Scholar]
- Woźniak, P. R., Vestrand, W. T., Wren, J. A., et al. 2006, ApJ, 642, L99 [Google Scholar]
- Xu, F., Tang, C.-H., Geng, J.-J., et al. 2021, ApJ, 920, 135 [NASA ADS] [CrossRef] [Google Scholar]
- Yadav, M., Troja, E., Ricci, R., et al. 2025, ArXiv e-prints [arXiv:2505.08781] [Google Scholar]
- Yin, Y.-H. I., Zhang, B.-B., Yang, J., et al. 2024, ApJ, 975, L27 [Google Scholar]
- Yin, Y. H. I., Fang, Y., Zhang, B. B., et al. 2025, ApJ, 989, L39 [Google Scholar]
- Yuan, W., Zhang, C., Feng, H., et al. 2015, ArXiv e-prints [arXiv:1506.07735] [Google Scholar]
- Yuan, W., Zhang, C., Chen, Y., & Ling, Z. 2022, Handbook of X-ray and Gamma-ray Astrophysics, 86 [Google Scholar]
- Yuan, W., Dai, L., Feng, H., et al. 2025, Sci. China Phys. Mech. Astron., 68, 239501 [Google Scholar]
- Zhang, B., Fan, Y. Z., Dyks, J., et al. 2006, ApJ, 642, 354 [Google Scholar]
- Zhang, B., Wang, X.-Y., & Zheng, J.-H. 2024, J. High Energy Astrophys., 41, 42 [NASA ADS] [CrossRef] [Google Scholar]
- Zhang, W., Yuan, W., Ling, Z., et al. 2025, Sci. China Phys. Mech. Astron., 68, 219511 [Google Scholar]
- Zheng, W., Brink, T. G., Filippenko, A. V., Yang, Y., & KAIT GRB Team 2024a, GRB Coordinates Network, 38294, 1 [Google Scholar]
- Zheng, W., Han, X., Zhang, P., Filippenko, V., & KAIT GRB team 2024b, GRB Coordinates Network, 37849, 1 [Google Scholar]
- Zheng, J.-H., Zhu, J.-P., Lu, W., & Zhang, B. 2025, ApJ, 985, 21 [Google Scholar]
Appendix A: Log of observations
Here we report the list of observations of EP241021a analyzed as part of this work. The observations are tabulated in Table A.1, A.2, and A.3. The photometry is not corrected for Galactic extinction E(B − V) = 0.045 mag (Schlafly & Finkbeiner 2011). The Galactic extinction in a given bandpass is tabulated below as Aλ (Schlafly & Finkbeiner 2011).
Log of optical and near-infrared imaging observations of EP241021a used in this work.
Log of optical spectroscopic observations of EP241021a used in this work.
Log of X-ray observations of EP241021a used in this work.
Appendix B: Additional results of optical and near-infrared light curve fitting
In §3.1, we outline our temporal and spectral fit to the OIR light curve of EP241021a using Equation 1. In Figure 2 we highlight the best fit to the light curve, where the initial α1 and final α3 temporal slopes are allowed to be independent. This provides an improved χ2 over the more restrictive fit where we require α1 = α3. The fit to the OIR light curves and the fit residuals for α1 = α3 are shown in Figure B.2, see also §3.1 for a more detailed discussion. Due to the worse residuals when α1 = α3 we favor the fit shown in Figure 2.
The corner plots for both fits are shown separately in Figures B.1 and B.3. The summary statistics shown in the corner plots are computed using the maximum of the marginalized posterior as best-fit value (presented as the mean value), and the 16th and 84th quantiles are used for the 1σ uncertainty. This corresponds to the MAX_CENTRAL option in ChainConsumer (Hinton 2016). We note that the only parameter where the 50th percentile is not the maximum of the marginalized posterior is the rising slope α2, which has an extremely skewed, non-Gaussian posterior.
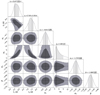 |
Fig. B.1. Corner plot for the broken powerlaw temporal and spectral fit Fν ∝ tανβ using Equation 1 to the multiband rzJ light curves of EP241021a (see §3.1). The dashed lines indicate the best-fit values in the full chain. The fit has χ2/dof = 164/77 = 2.13. |
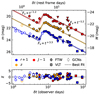 |
Fig. B.2. Same as Figure 2 but for the temporal and spectral fit (see Equation 1) where α1 = α3. Top: The fit to the multi-filter light curve. Bottom: The fit residuals are shown in each filter. The residuals are more significant than in Figure 2, especially at early times in r-band. |
light curve model fitting priors.
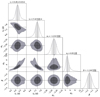 |
Fig. B.3. Corner plot for the broken powerlaw temporal and spectral fit Fν ∝ tανβ using Equation 1 with α3 = α1 to the multiband rzJ light curves of EP241021a (see §3.1). The dashed lines indicate the best-fit values in the full chain. The fit has χ2/dof = 201/76 = 2.58. |
Appendix C: Supernova model fitting
We applied five different MOSFiT models to EP241021a: i) default (corresponding to the radioactive decay of 56Ni; Nadyozhin 1994), ii) csm (Chatzopoulos et al. 2013; Villar et al. 2017), iii) csmni, iv) magnetar (Nicholl et al. 2017), and v) magni. To fit the second component (starting from MJD = 60609.81) of EP241021 using MOSFiT, we fix the explosion time to the EP trigger, such that texp = −5.60 days prior to the onset of the rebrightening. The γ-ray opacity (κγ) was fixed to 0.027 cm2 g−1 (Cappellaro et al. 1997). We perform the fit using the dynamic nested sampling approach implemented in MOSFiT using the dynesty package (Speagle 2020; Koposov et al. 2024). For the magnetar model, we set similar priors as Gomez et al. (2022) to model superluminous supernovae, but decreased the range of the magnetar spin period to Pspin ∈ [0.7, 10] ms. Instead of log-flat priors for fNi, vej, and B⊥ we chose a flat prior. For csm and csmni, we apply similar priors as in Nicholl et al. (2020), Suzuki et al. (2021), Chen et al. (2023). We find that none of the models are capable of matching the observed light curve. For a more detailed overview of the priors for each model, see C.1. Relevant posteriors are listed in C.2.
Supernova model fitting priors.
Supernova model fitting results.
All Tables
Log of optical and near-infrared imaging observations of EP241021a used in this work.
All Figures
|
Fig. 1. Finding chart of EP241021a combining all FTW r-band exposures (38.1 h total). The location of the transient (blue) lies within the X-ray localizations from Swift/XRT (orange) and EP/FXT (red). |
| In the text | |
|
Fig. 2. Top: Optical to near-infrared light curve of EP241021a in the r, i, and J filters. Our observations, obtained with the FTW and the VLT are supplemented with observations reported in General Coordinates Network (GCN) Circulars (Fu et al. 2024a,b; Li et al. 2024b; Ror et al. 2024; Li et al. 2024a; Zheng et al. 2024b; Pugliese et al. 2024; Bochenek & Perley 2024a; Quirola-Vasquez et al. 2024; Freeburn et al. 2024b; Schneider & Adami 2024b; Bochenek & Perley 2024b; Schneider & Adami 2024a). The best fit of the light curve using Equation 1 is indicated by the dotted lines, with 1000 random draws from the posterior plotted in the background. The Galactic extinction-corrected apparent magnitude, m, is shown on the left ordinate, and the K-corrected absolute magnitude, M, assuming z = 0.748 is shown on the right (see Section 3.3). The lower abscissa indicates the time since the EP trigger in the observer frame, while the upper axis is converted to the rest frame of the source. Bottom: Deviation of the data from the best fit, normalized by their uncertainties. The symbols are the same as for the upper panel but with no offset applied. The x-axes are identical to those in the top panel. |
| In the text | |
|
Fig. 3. Optical spectrum of EP241021a obtained on 2024 October 29 using LRS2-R at HET, shown in red, with the associated error spectrum in gray. No clear continuum is detected, but a single emission feature corresponding to [OII]λ3729 at z = 0.748 is identified. This is consistent with previous reports of emission features underlying EP241021a (Shu et al. 2025). For display purposes, the data are smoothed with a Savitzky–Golay filter of 5 pixels. |
| In the text | |
|
Fig. 4. Evolution of the r − z and r − J colors of EP241021a. The earliest color information was provided in the GCN circular by Fu et al. (2024a), while all other datapoints are derived from our FTW observations (Section 2.2). |
| In the text | |
|
Fig. 5. Multi-epoch SED of EP241021a from X-ray to NIR frequencies, using Swift/XRT and FTW data. The three epochs correspond to pre-peak, peak, and post-peak SEDs. The uncertainty on the X-ray spectral index (νβ) is shown as a shaded region, with the median indicated by a dotted line. The dashed lines connecting the X-ray and OIR data use the best-fitting OIR spectral index, βOIR = −1.09. The X-ray data are consistent with the extrapolation of the OIR spectral index. |
| In the text | |
|
Fig. 6. Left: Isotropic-equivalent gamma-ray energies (1 − 10 000 keV; rest frame) of both short (black squares) and long duration (gray circles) GRBs versus redshift (Sakamoto et al. 2011; Lien et al. 2016; Atteia et al. 2017; O’Connor et al. 2024). A population of low-luminosity GRBs is shown with orange pentagons (e.g., Iwamoto et al. 1998; Galama et al. 1998, 1999; Malesani et al. 2004; Sakamoto et al. 2004; Soderberg et al. 2004a,b, 2006; Campana et al. 2006; Ofek et al. 2007; Starling et al. 2011; Cano et al. 2011; D’Elia et al. 2018; Izzo et al. 2019; HESS Collaboration 2021; Dichiara et al. 2022). The approximate energy release (0.5 − 4 keV; rest frame) of the initial EP detection of EP241021a is shown as a red star (Section 2.1; Hu et al. 2024). No bolometric correction has been applied due to the unknown spectral shape at > 4 keV; the presented energy is therefore a lower bound. Downward red arrows indicate the gamma-ray limits for EP241021a from Konus-Wind for gamma-ray emission durations between 3 s (bottom arrow) and 100 s (top arrow). The 1 − 10 000 keV energy release of EP241021a is bounded by these values. For comparison, EP240414a is shown as a blue diamond (0.5 − 4 keV; Sun et al. 2025). Right: Rest-frame X-ray light curves (0.3 − 10 keV) of Swift long GRBs (gray; duration > 2 s) and low-luminosity GRBs (orange; GRBs 060218, 100316D, 171205A, and 190829A) compared with X-ray light curves of EP241021a (taken from Shu et al. 2025) and EP240414a (taken from Sun et al. 2025; van Dalen et al. 2025). |
| In the text | |
|
Fig. 7. Rest-frame X-ray plateau duration and luminosity for GRBs (Tang et al. 2019; Xu et al. 2021) and FXTs (Quirola-Vásquez et al. 2024) compared to EP240414a (blue shaded region; Sun et al. 2025; van Dalen et al. 2025) and EP241021a (red shaded region; Shu et al. 2025). The dotted line illustrates the extension of the GRB plateau correlation and is shown as a visual guide. |
| In the text | |
|
Fig. 8. Comparison between supernova models and the observed r-band optical light curve. The best-fits to the second component are shown for a range of MOSFiT models (default, magnetar, magni, csm, and csmni; see Section 4.6.1). Fits to the other filters (z and J) are either poor, or require large amounts of dust and extreme absolute magnitudes. |
| In the text | |
|
Fig. 9. Optical light curves (r-band) of GRBs exhibiting rapid and significant rebrightening (see 4.6.3). These are compared to EP240414a (Srivastav et al. 2025; van Dalen et al. 2025; Sun et al. 2025) and EP241021a (this work). The sample includes GRBs 970508 (Pian et al. 1998), 060206 (Woźniak et al. 2006), 060906 (Cenko et al. 2009), 081029 (Nardini et al. 2011), 100418A (Marshall et al. 2011; de Ugarte Postigo et al. 2018), 100621A (Greiner et al. 2013), 100901A (Gorbovskoy et al. 2012), 111209A (Kann et al. 2018), and 130831A (Cano et al. 2014). The solid lines show the data smoothed using a median filter. Reproduced from de Ugarte Postigo et al. (2018). |
| In the text | |
|
Fig. B.1. Corner plot for the broken powerlaw temporal and spectral fit Fν ∝ tανβ using Equation 1 to the multiband rzJ light curves of EP241021a (see §3.1). The dashed lines indicate the best-fit values in the full chain. The fit has χ2/dof = 164/77 = 2.13. |
| In the text | |
|
Fig. B.2. Same as Figure 2 but for the temporal and spectral fit (see Equation 1) where α1 = α3. Top: The fit to the multi-filter light curve. Bottom: The fit residuals are shown in each filter. The residuals are more significant than in Figure 2, especially at early times in r-band. |
| In the text | |
|
Fig. B.3. Corner plot for the broken powerlaw temporal and spectral fit Fν ∝ tανβ using Equation 1 with α3 = α1 to the multiband rzJ light curves of EP241021a (see §3.1). The dashed lines indicate the best-fit values in the full chain. The fit has χ2/dof = 201/76 = 2.58. |
| In the text | |
Current usage metrics show cumulative count of Article Views (full-text article views including HTML views, PDF and ePub downloads, according to the available data) and Abstracts Views on Vision4Press platform.
Data correspond to usage on the plateform after 2015. The current usage metrics is available 48-96 hours after online publication and is updated daily on week days.
Initial download of the metrics may take a while.