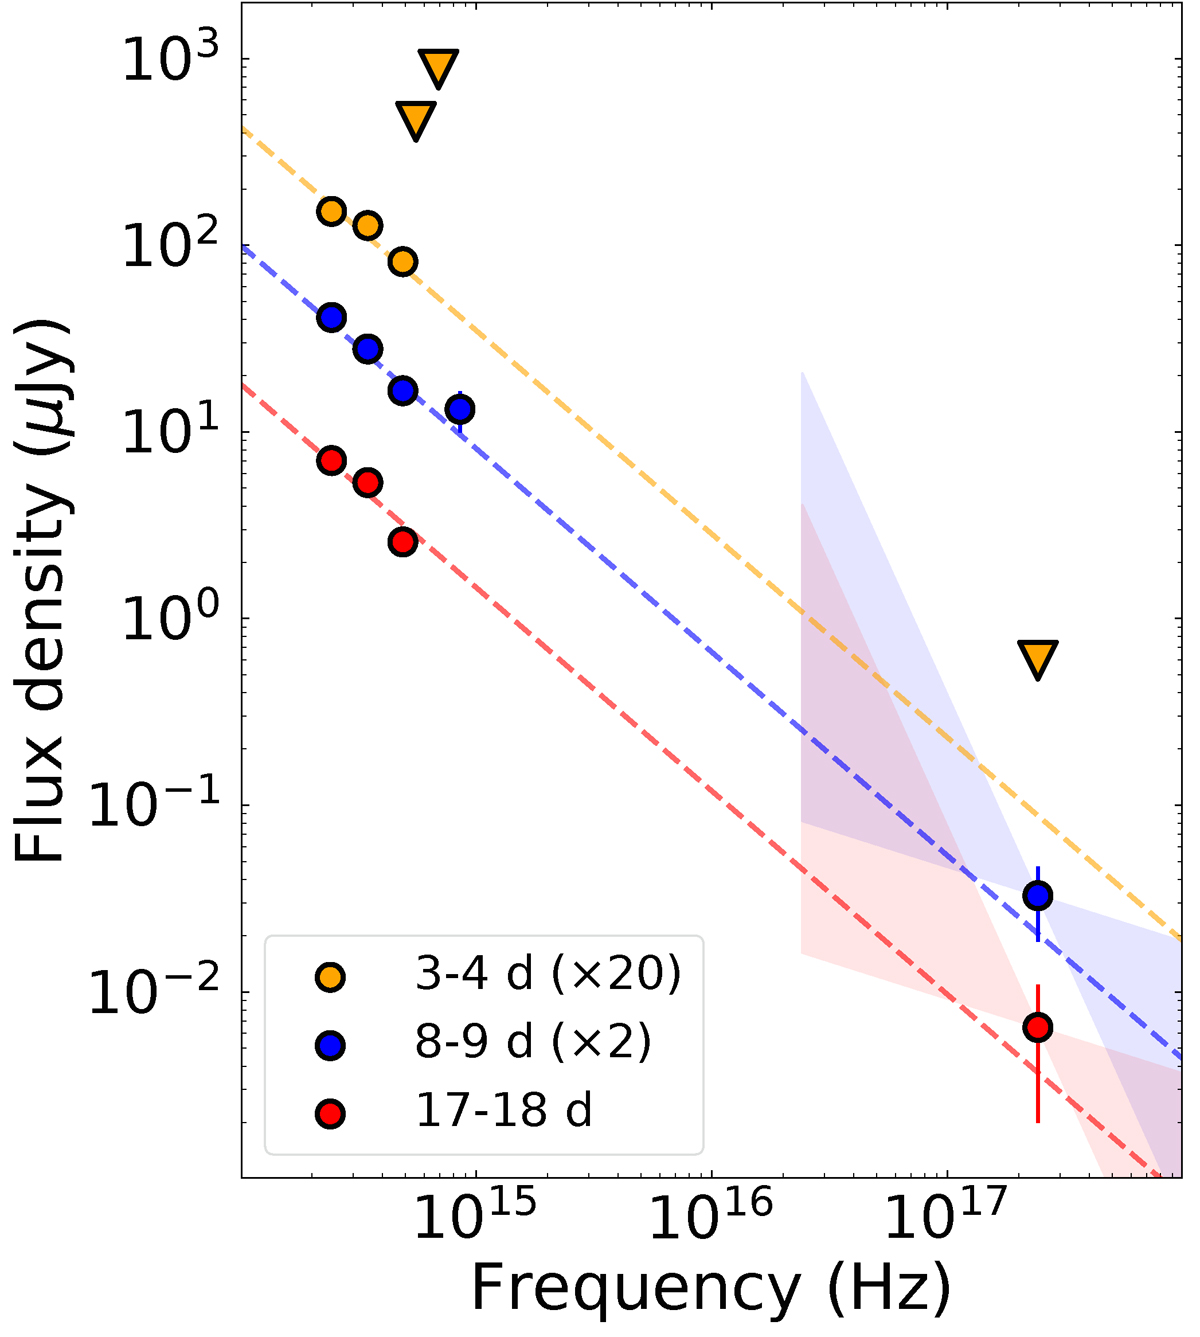
Fig. 5.
Download original image
Multi-epoch SED of EP241021a from X-ray to NIR frequencies, using Swift/XRT and FTW data. The three epochs correspond to pre-peak, peak, and post-peak SEDs. The uncertainty on the X-ray spectral index (νβ) is shown as a shaded region, with the median indicated by a dotted line. The dashed lines connecting the X-ray and OIR data use the best-fitting OIR spectral index, βOIR = −1.09. The X-ray data are consistent with the extrapolation of the OIR spectral index.
Current usage metrics show cumulative count of Article Views (full-text article views including HTML views, PDF and ePub downloads, according to the available data) and Abstracts Views on Vision4Press platform.
Data correspond to usage on the plateform after 2015. The current usage metrics is available 48-96 hours after online publication and is updated daily on week days.
Initial download of the metrics may take a while.