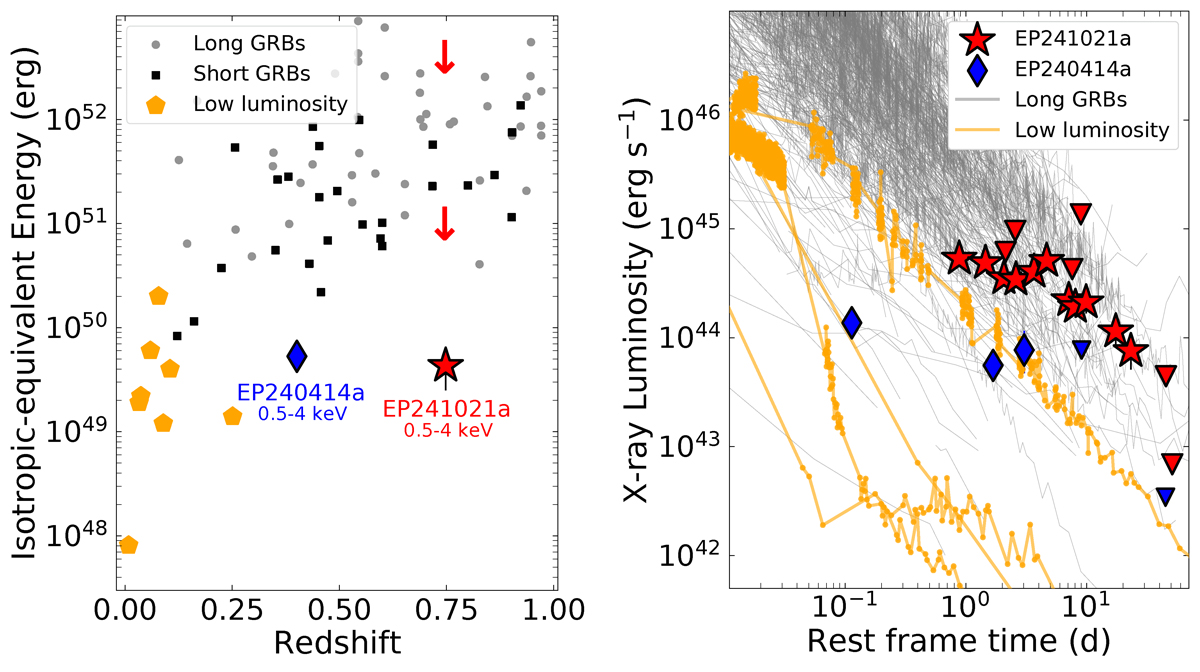
Fig. 6.
Download original image
Left: Isotropic-equivalent gamma-ray energies (1 − 10 000 keV; rest frame) of both short (black squares) and long duration (gray circles) GRBs versus redshift (Sakamoto et al. 2011; Lien et al. 2016; Atteia et al. 2017; O’Connor et al. 2024). A population of low-luminosity GRBs is shown with orange pentagons (e.g., Iwamoto et al. 1998; Galama et al. 1998, 1999; Malesani et al. 2004; Sakamoto et al. 2004; Soderberg et al. 2004a,b, 2006; Campana et al. 2006; Ofek et al. 2007; Starling et al. 2011; Cano et al. 2011; D’Elia et al. 2018; Izzo et al. 2019; HESS Collaboration 2021; Dichiara et al. 2022). The approximate energy release (0.5 − 4 keV; rest frame) of the initial EP detection of EP241021a is shown as a red star (Section 2.1; Hu et al. 2024). No bolometric correction has been applied due to the unknown spectral shape at > 4 keV; the presented energy is therefore a lower bound. Downward red arrows indicate the gamma-ray limits for EP241021a from Konus-Wind for gamma-ray emission durations between 3 s (bottom arrow) and 100 s (top arrow). The 1 − 10 000 keV energy release of EP241021a is bounded by these values. For comparison, EP240414a is shown as a blue diamond (0.5 − 4 keV; Sun et al. 2025). Right: Rest-frame X-ray light curves (0.3 − 10 keV) of Swift long GRBs (gray; duration > 2 s) and low-luminosity GRBs (orange; GRBs 060218, 100316D, 171205A, and 190829A) compared with X-ray light curves of EP241021a (taken from Shu et al. 2025) and EP240414a (taken from Sun et al. 2025; van Dalen et al. 2025).
Current usage metrics show cumulative count of Article Views (full-text article views including HTML views, PDF and ePub downloads, according to the available data) and Abstracts Views on Vision4Press platform.
Data correspond to usage on the plateform after 2015. The current usage metrics is available 48-96 hours after online publication and is updated daily on week days.
Initial download of the metrics may take a while.