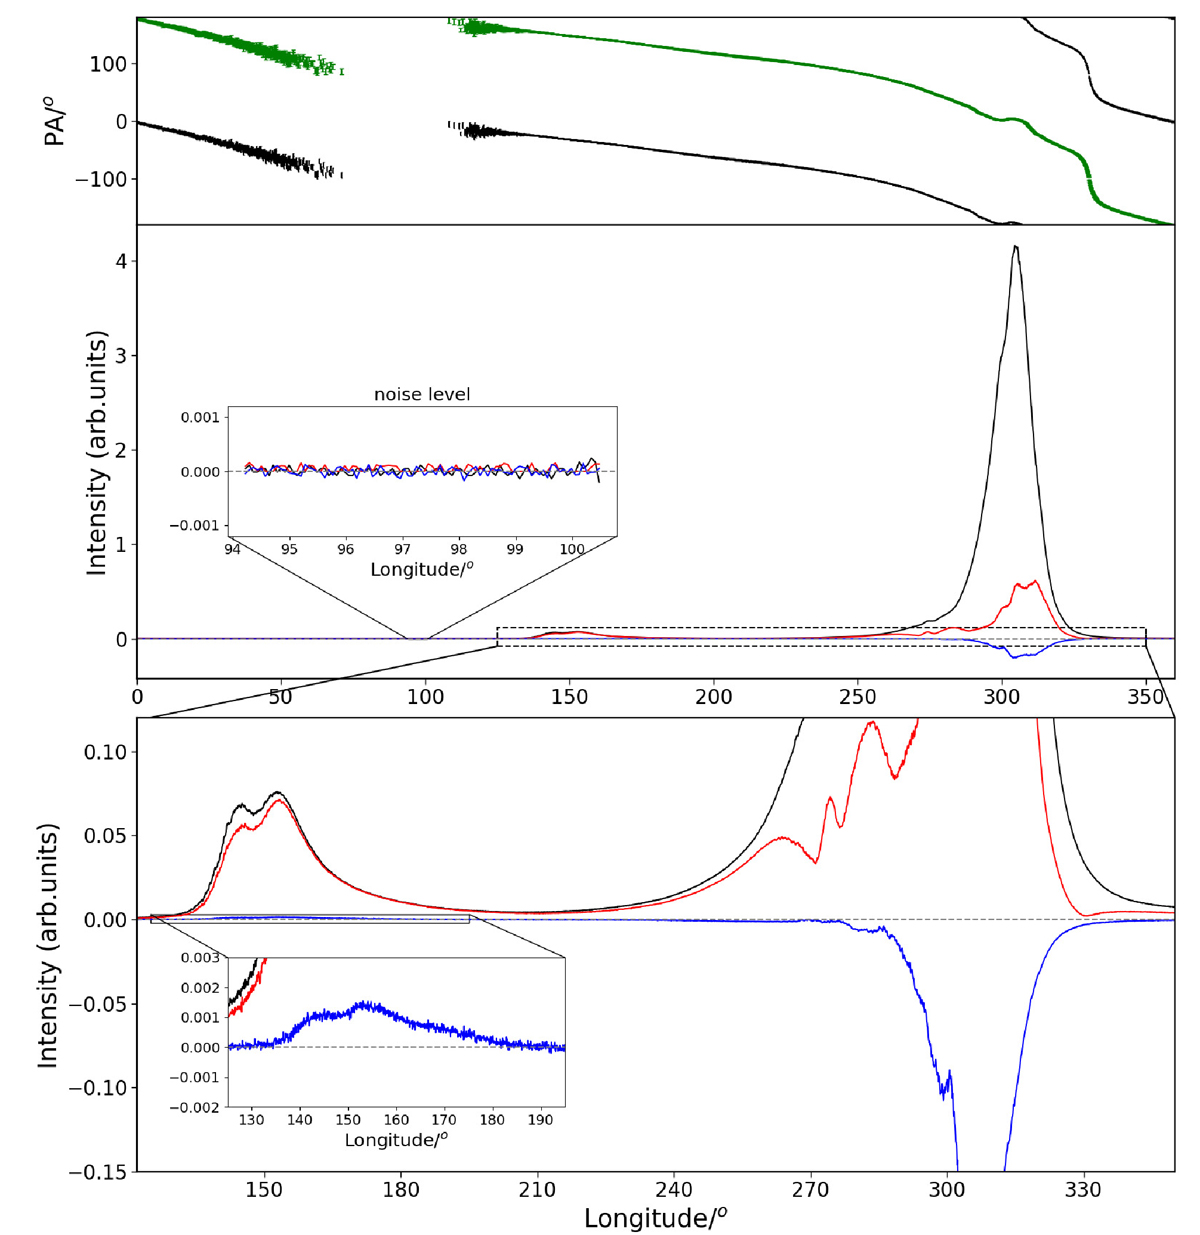
Fig. 1.
Download original image
Total average pulse profile of PSR B0950+08. The top panel shows the PA curve of the total average pulse profile with σψ < 5°, along with the curve of PA ± 180°. To facilitate analysis of PA properties, the green curve representing the continuous variation of PA is plotted. The middle panel displays the average pulse profiles of total intensity I (solid black line), linear polarization L (solid red line) and circular polarization V (solid blue line), respectively. The zoom-in box shows the noise level region. The bottom panel presents a zoomed-in view of the region as outlined by the dashed box in the middle panel. The zoomed-in view of the circular polarization of the interpulse is shown within the rectangular box in the bottom panel.
Current usage metrics show cumulative count of Article Views (full-text article views including HTML views, PDF and ePub downloads, according to the available data) and Abstracts Views on Vision4Press platform.
Data correspond to usage on the plateform after 2015. The current usage metrics is available 48-96 hours after online publication and is updated daily on week days.
Initial download of the metrics may take a while.