Fig. 14.
Download original image
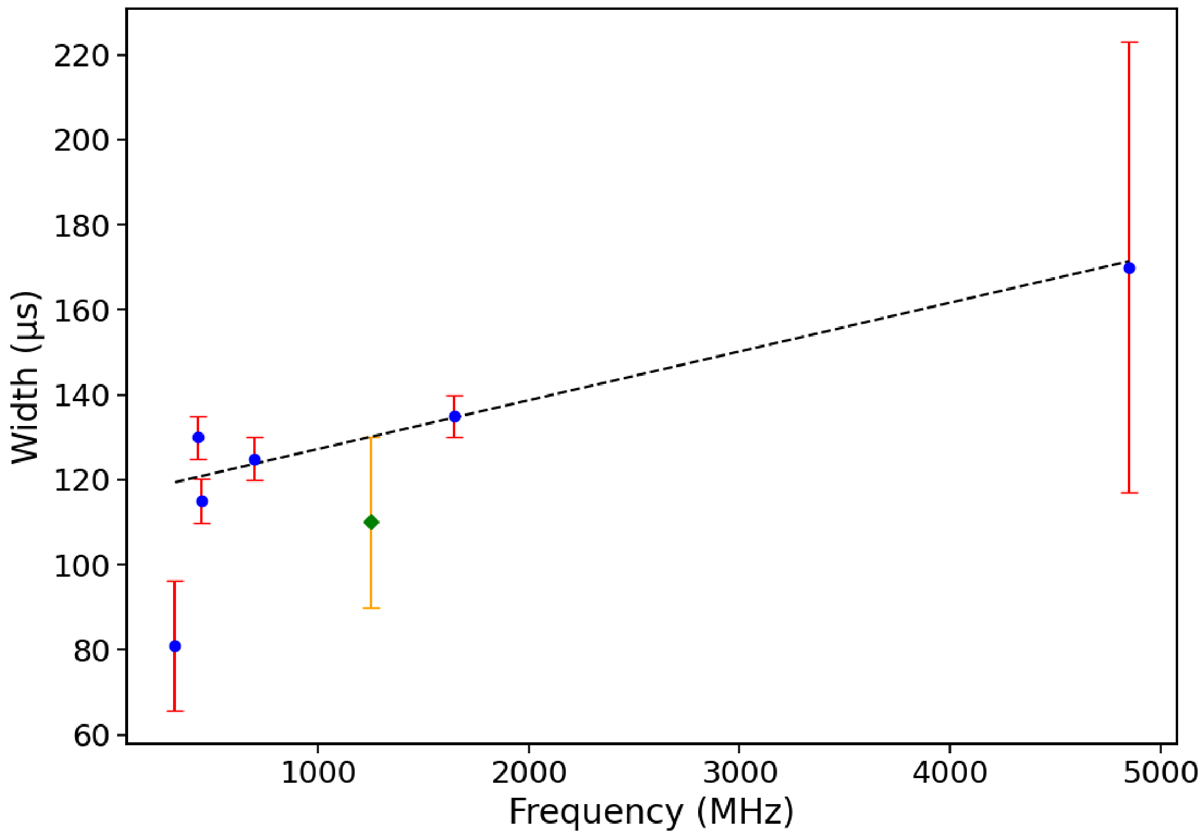
Relationship between periodic microstructure width tμ of PSR B0950+08 and observational frequency. Data include results from previous studies and our own calculations listed in Table 1. Blue dots indicate literature values, while the green diamond represents our calculation. The dashed black line indicates the result of a linear fit.
Current usage metrics show cumulative count of Article Views (full-text article views including HTML views, PDF and ePub downloads, according to the available data) and Abstracts Views on Vision4Press platform.
Data correspond to usage on the plateform after 2015. The current usage metrics is available 48-96 hours after online publication and is updated daily on week days.
Initial download of the metrics may take a while.