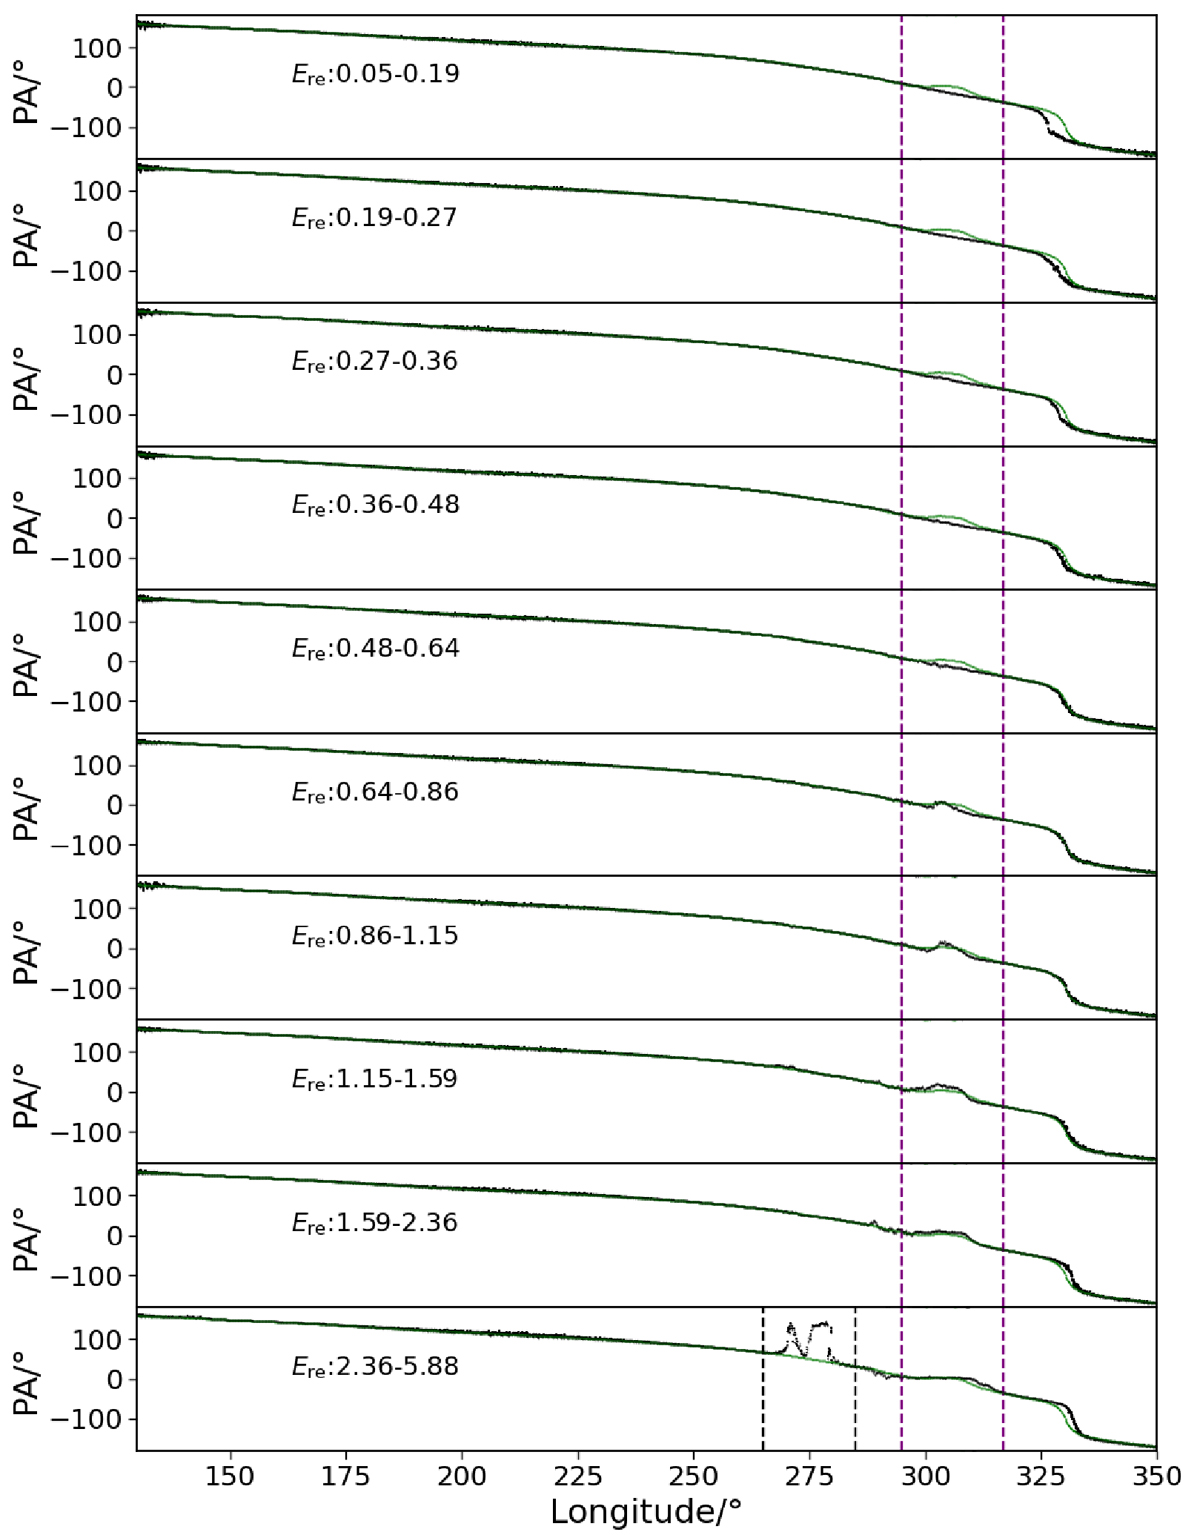
Fig. 5.
Download original image
PA curves corresponding to the ten average pulse profiles. The green line represents the PA curve corresponding to the total average pulse profile. From top to bottom, the Ere values gradually increase. The dashed black region in the last panel corresponds to the longitude range 265–285°. The dashed purple region indicates the longitude range 295–317°.
Current usage metrics show cumulative count of Article Views (full-text article views including HTML views, PDF and ePub downloads, according to the available data) and Abstracts Views on Vision4Press platform.
Data correspond to usage on the plateform after 2015. The current usage metrics is available 48-96 hours after online publication and is updated daily on week days.
Initial download of the metrics may take a while.