Fig. 8.
Download original image
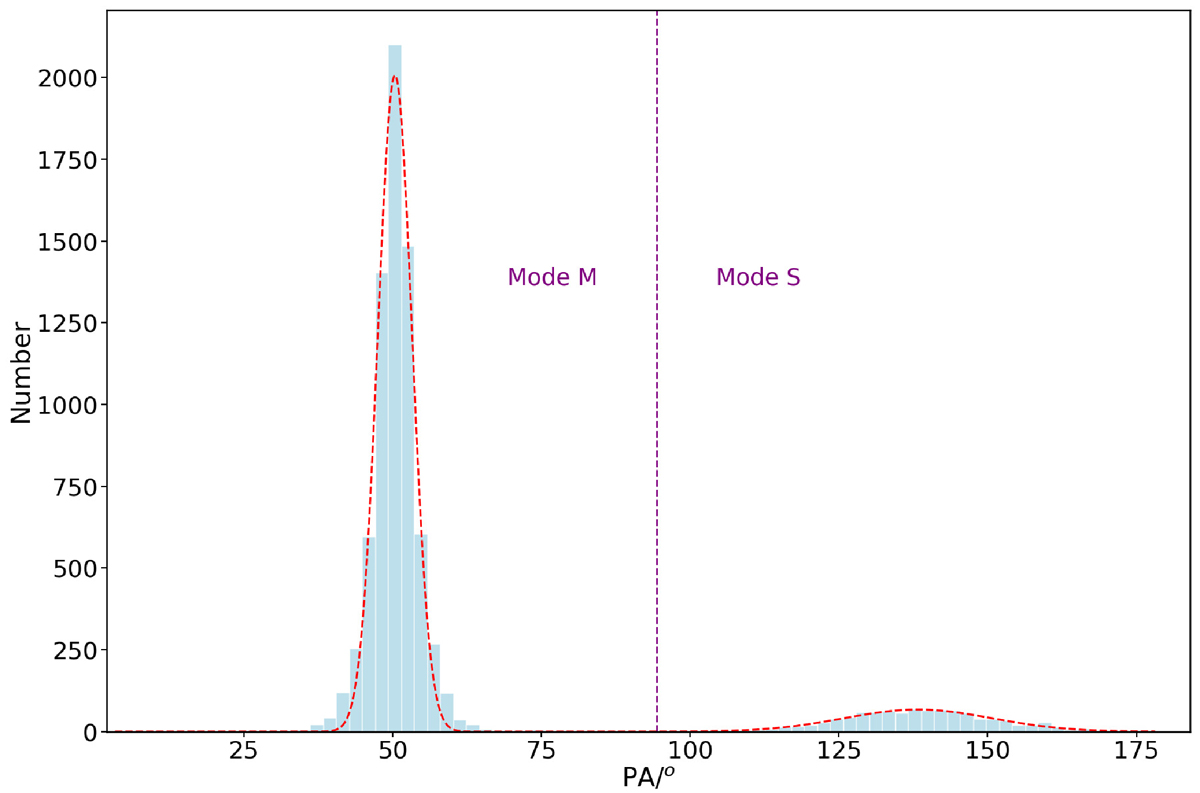
Statistical distribution of the PA of single pulses at longitude I. The dashed red lines represent the result of fitting two Gaussian functions. The dashed purple vertical line indicates the midpoint between the peak positions of the Gaussian functions, with the areas on either side corresponding to the two modes, Mode M and Mode S.
Current usage metrics show cumulative count of Article Views (full-text article views including HTML views, PDF and ePub downloads, according to the available data) and Abstracts Views on Vision4Press platform.
Data correspond to usage on the plateform after 2015. The current usage metrics is available 48-96 hours after online publication and is updated daily on week days.
Initial download of the metrics may take a while.