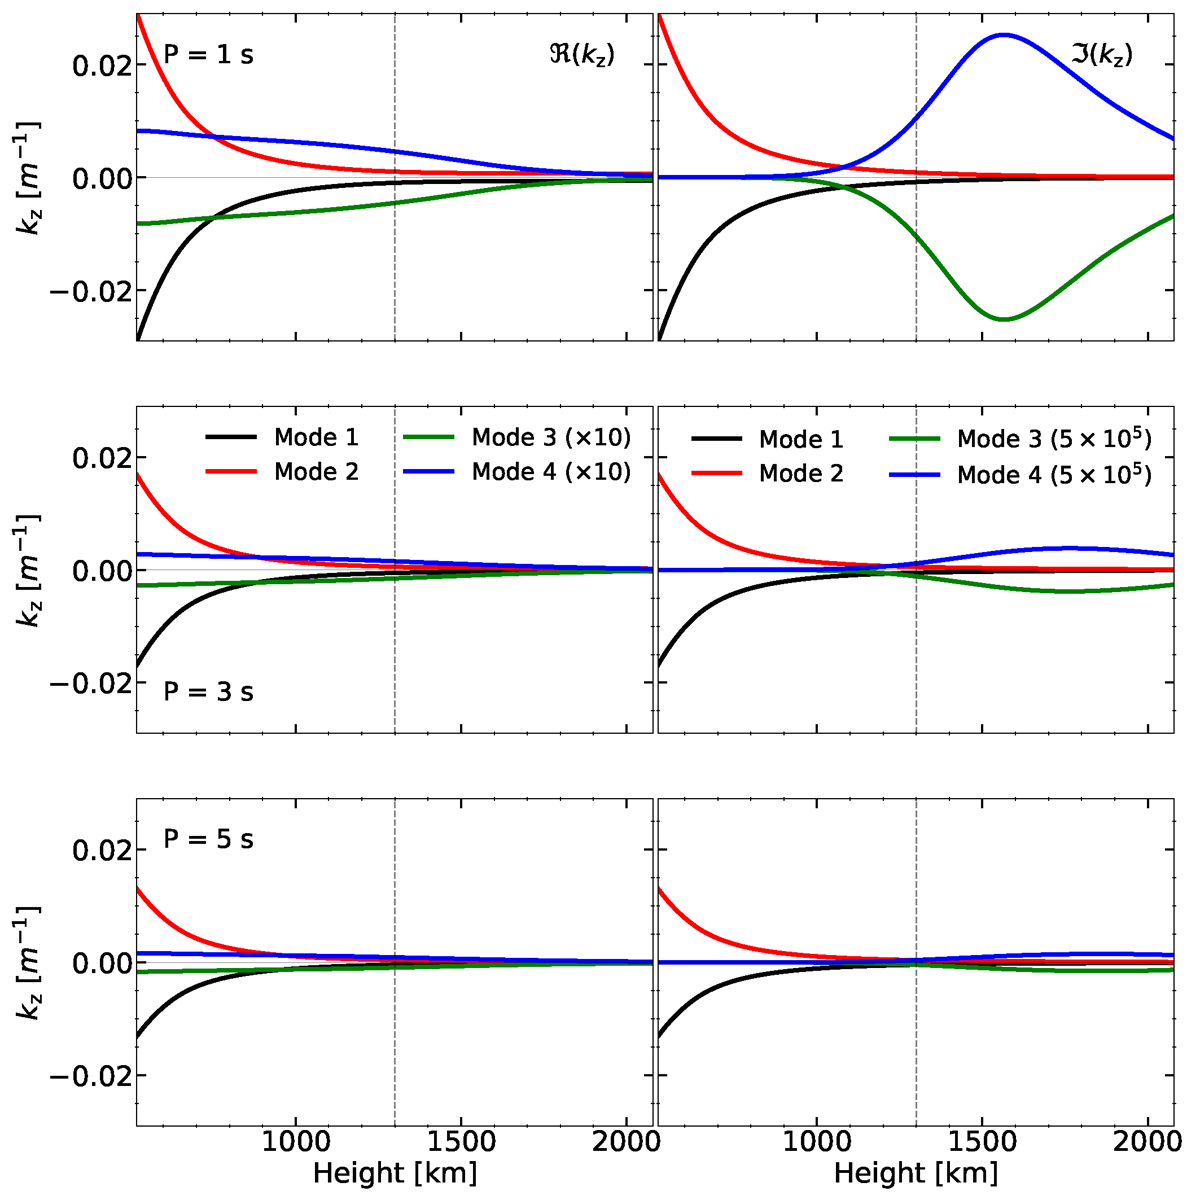
Fig. 10.
Download original image
Vertical wave numbers for the 2F model as functions of height for all wave periods studied in this work. From top to bottom, the wave periods are 1 s, 3 s, and 5 s. Blue and green solid lines: upward and downward fast mode. Red and black solid lines: Upward and downward normal mode (different from the fast mode). The left column represents the real part and the right represents the imaginary part. The fast mode lines are multiplied by an arbitrary factor for the representation. The vertical dashed line indicates the equipartition layer βplasma = 1.
Current usage metrics show cumulative count of Article Views (full-text article views including HTML views, PDF and ePub downloads, according to the available data) and Abstracts Views on Vision4Press platform.
Data correspond to usage on the plateform after 2015. The current usage metrics is available 48-96 hours after online publication and is updated daily on week days.
Initial download of the metrics may take a while.