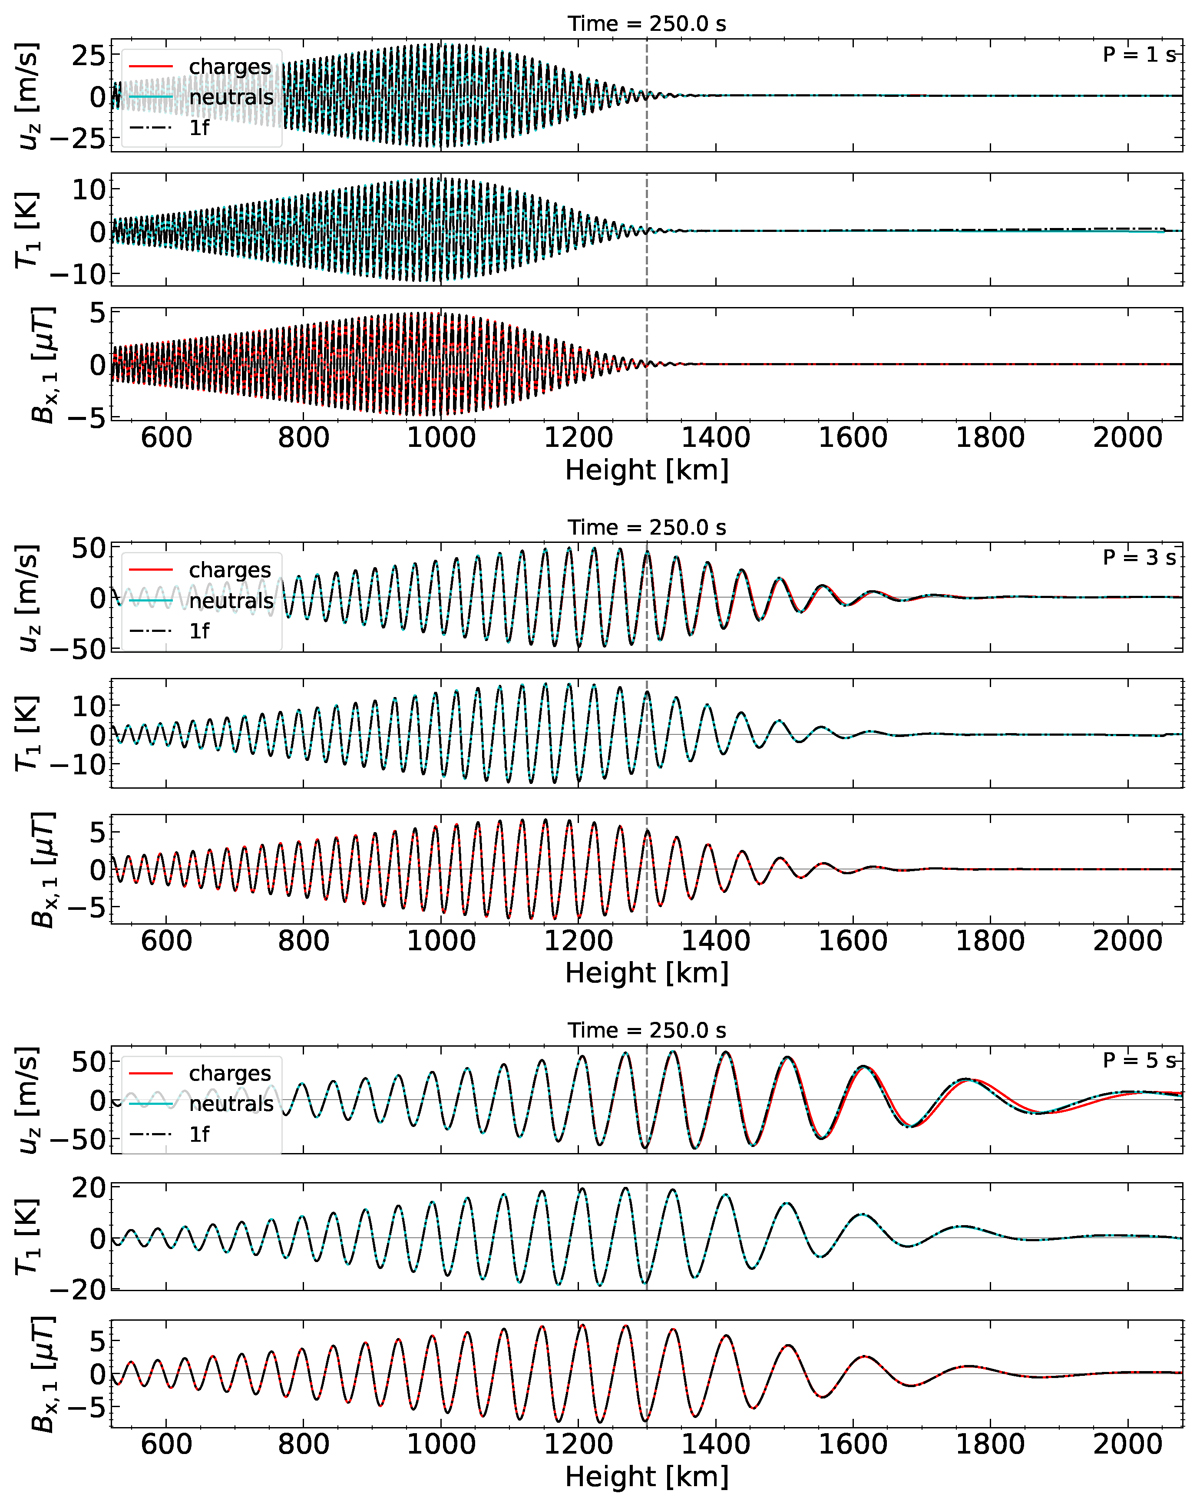
Fig. 2.
Download original image
Groups of panels from top to bottom: comparison between the numerical solution of velocity, temperature and magnetic field perturbations for waves of period P = 1 s, 3 s and 5 s at 250 s after the start of the simulation. Solid red lines: Perturbations in the velocity, temperature of charges and perturbations in the magnetic field in the 2F model. Solid cyan lines: Same for neutrals in 2F model. Black dashed lines: Same for the 1F model. The equipartition layer βplasma = 1 is indicated with a grey dashed vertical line.
Current usage metrics show cumulative count of Article Views (full-text article views including HTML views, PDF and ePub downloads, according to the available data) and Abstracts Views on Vision4Press platform.
Data correspond to usage on the plateform after 2015. The current usage metrics is available 48-96 hours after online publication and is updated daily on week days.
Initial download of the metrics may take a while.