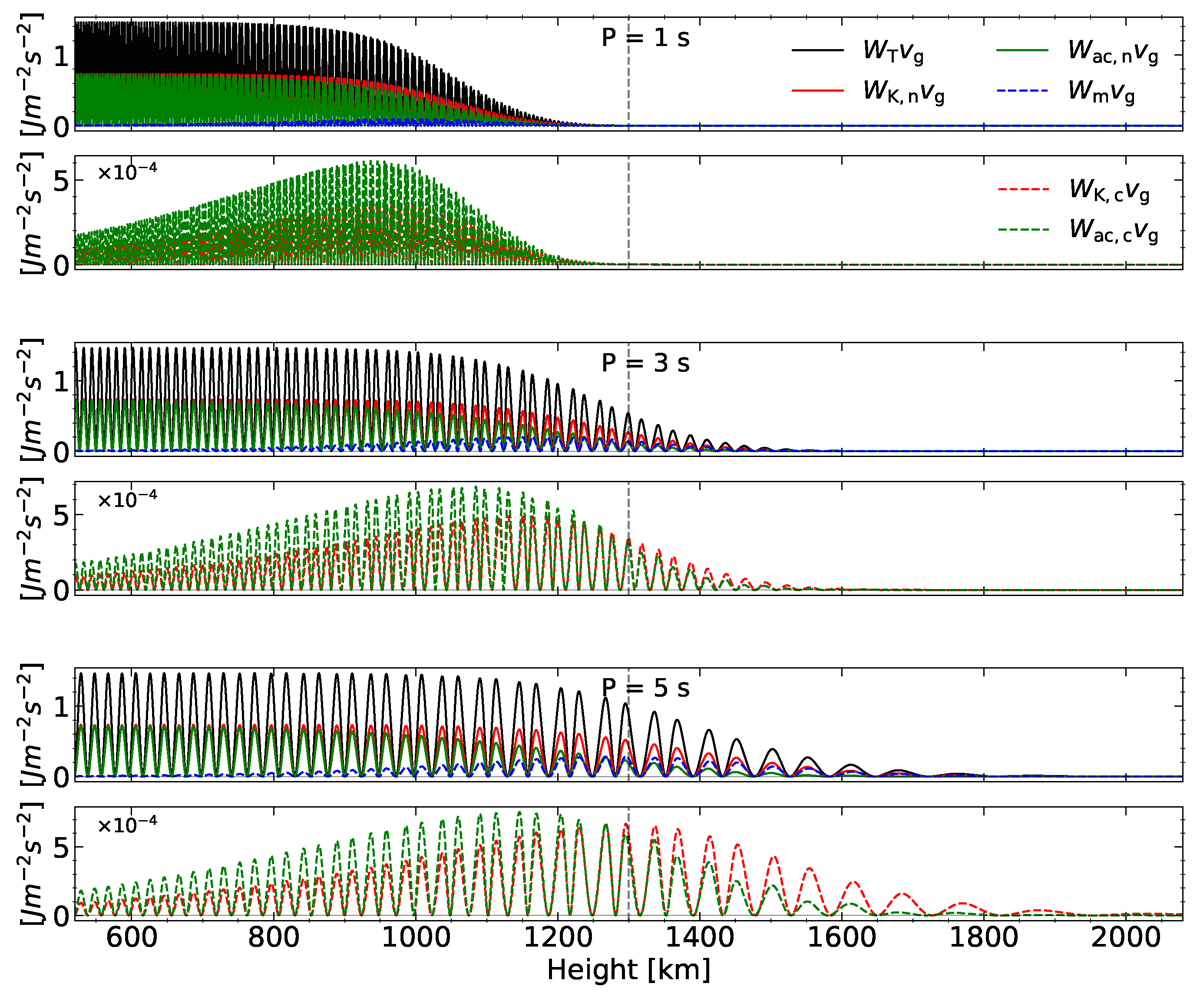
Fig. 8.
Download original image
Representation of the 2F wave energy flux contributions for the three wave periods studied in this work. From the top to the bottom in groups of two plots, the wave periods are 1 s, 3 s, and 5 s, respectively. Blue line: the magnetic energy (Wm). Green line: Acoustic energy (Wac, α). Red line: Kinetic energy (WK, α). Black line: Total energy (WT). The terms of the neutrals are shown in solid lines and terms for the charges in dashed lines. We split the terms WK, c and Wac, c in panels separated from neutrals due to the difference in scale. The vertical dashed line indicates the equipartition layer βplasma = 1.
Current usage metrics show cumulative count of Article Views (full-text article views including HTML views, PDF and ePub downloads, according to the available data) and Abstracts Views on Vision4Press platform.
Data correspond to usage on the plateform after 2015. The current usage metrics is available 48-96 hours after online publication and is updated daily on week days.
Initial download of the metrics may take a while.