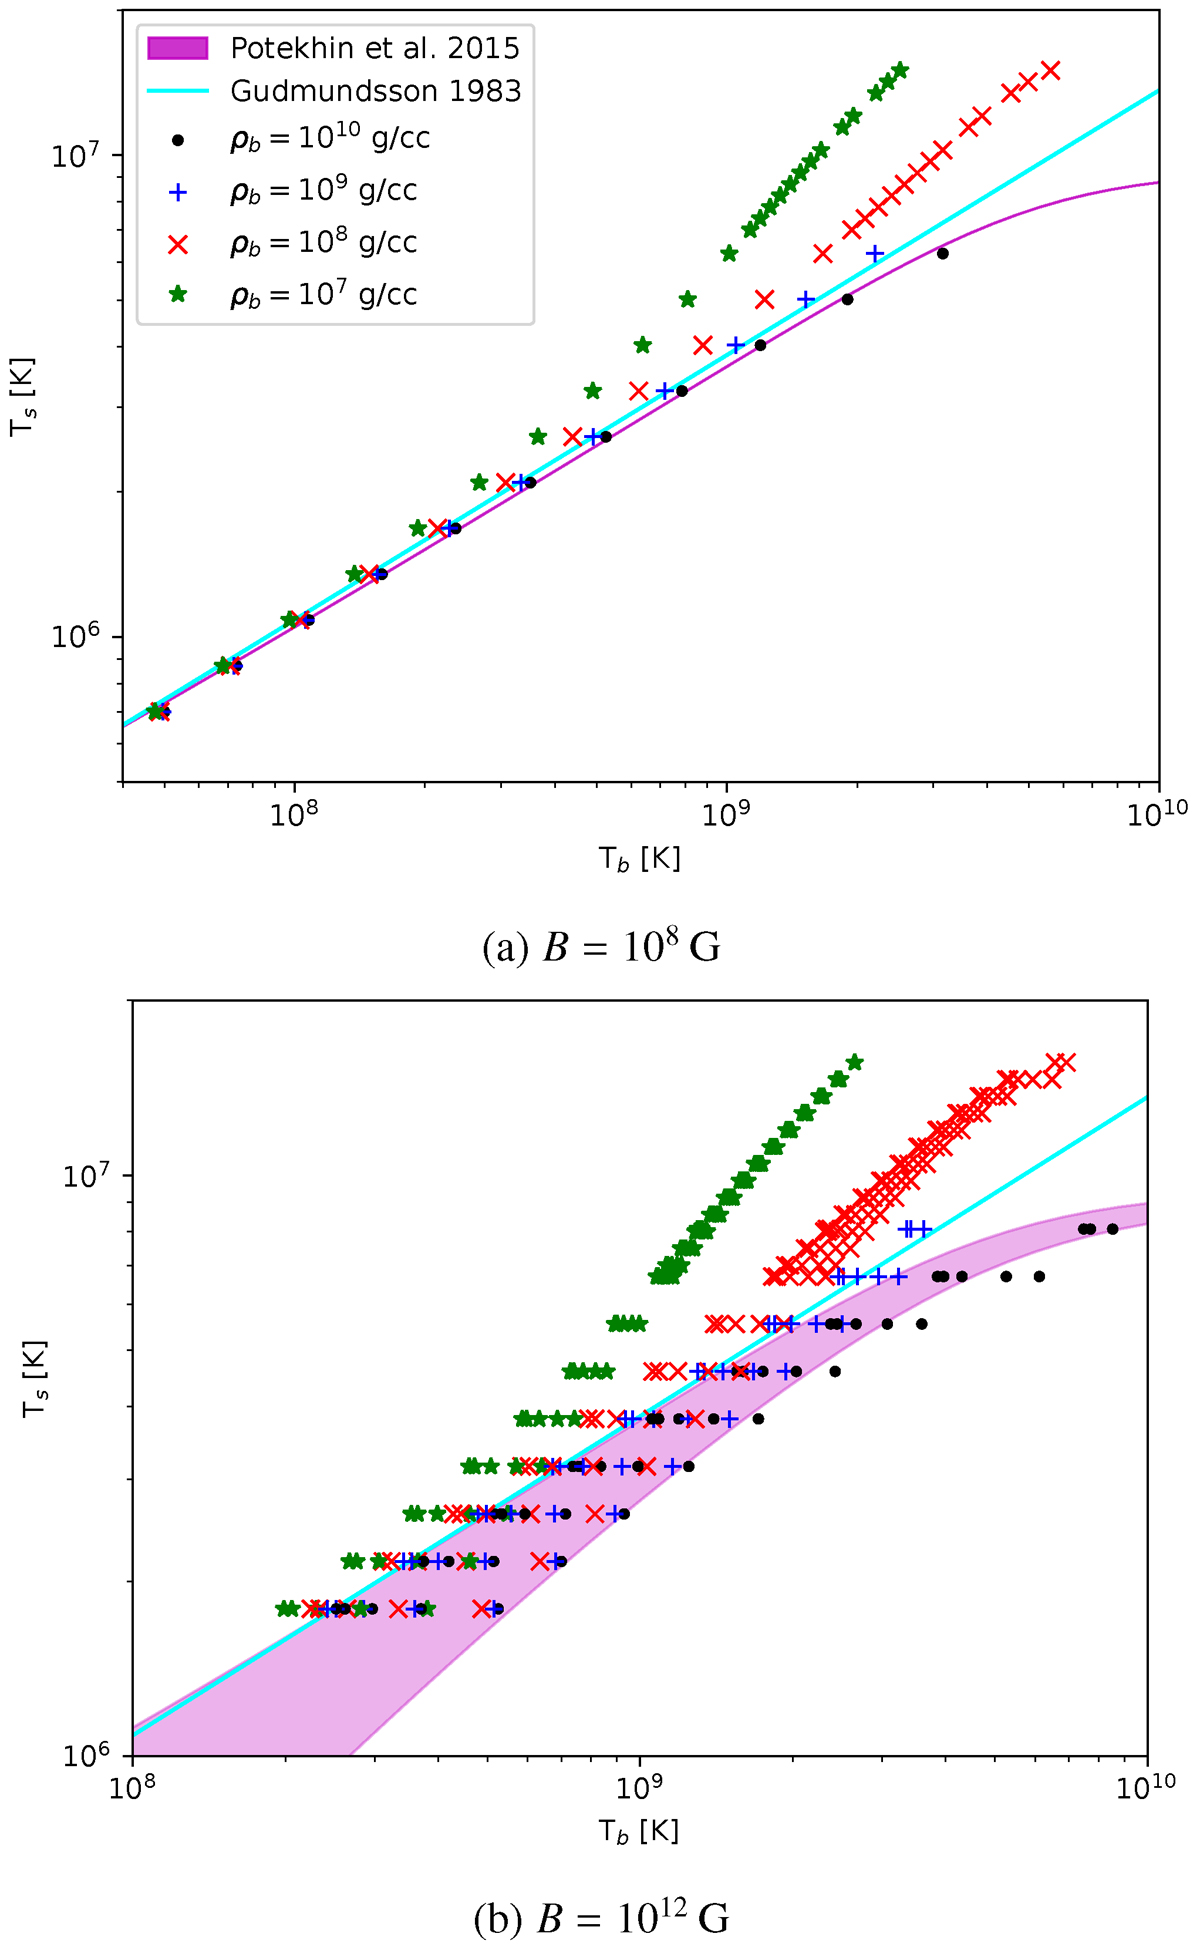
Fig. 1.
Download original image
Tb–Ts relations calculated for a sample of representative values of Ts in the case of Fe envelopes. Different colours and markers denote different bottom-of-the-envelope densities ρb. The models from Gudmundsson et al. (1983) and Potekhin et al. (2015), calculated for the standard value ρb = 1010 g cm−3, are plotted for reference. The spread of the points at the same Ts (which is noticeable only in the bottom panel) corresponds to different ΘB, with higher Tb giving a lower Ts value for the same Tb. Two values for the magnetic field, 108 G (top panel) and 1012 G (bottom panel) are shown; these values have been chosen, although comparatively low, for clarity of visualisation, as stronger fields yield very sparse plots.
Current usage metrics show cumulative count of Article Views (full-text article views including HTML views, PDF and ePub downloads, according to the available data) and Abstracts Views on Vision4Press platform.
Data correspond to usage on the plateform after 2015. The current usage metrics is available 48-96 hours after online publication and is updated daily on week days.
Initial download of the metrics may take a while.