Fig. 3.
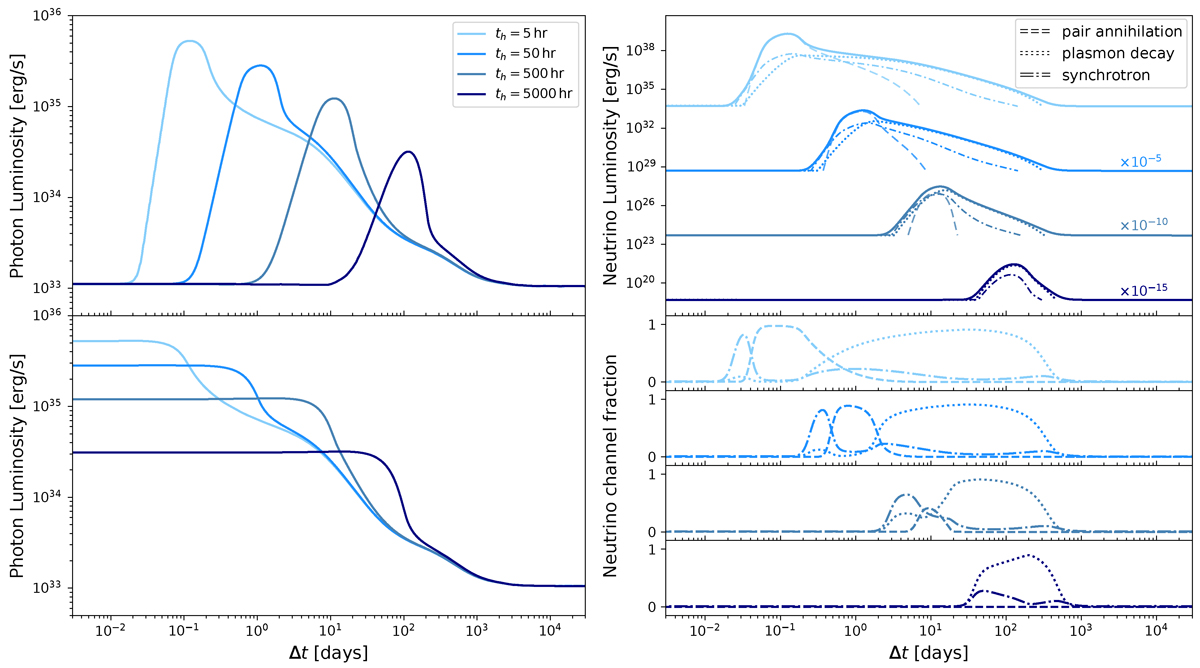
Download original image
(Left) Evolution of the photon luminosity varying the time tinj for which the injection term is active while keeping the other parameters fixed (though not visually obvious due to the log scale, the total area under each set of curves is the same). The lower panel shows the same curves as the upper one, but with Δt = 0 corresponding to the time of the peak rather than the time of heating onset to more directly compare to the curves displayed in observational studies (see text). (Upper right) Corresponding neutrino luminosity, rescaled for visualisation as in Fig. 2. For clarity, the contribution of the neutrino processes are shown separately only when they are above the quiescence level. (Lower right) Fraction of the total neutrino luminosity coming from the different crustal neutrino reactions that get activated during the outbursts.
Current usage metrics show cumulative count of Article Views (full-text article views including HTML views, PDF and ePub downloads, according to the available data) and Abstracts Views on Vision4Press platform.
Data correspond to usage on the plateform after 2015. The current usage metrics is available 48-96 hours after online publication and is updated daily on week days.
Initial download of the metrics may take a while.