Open Access
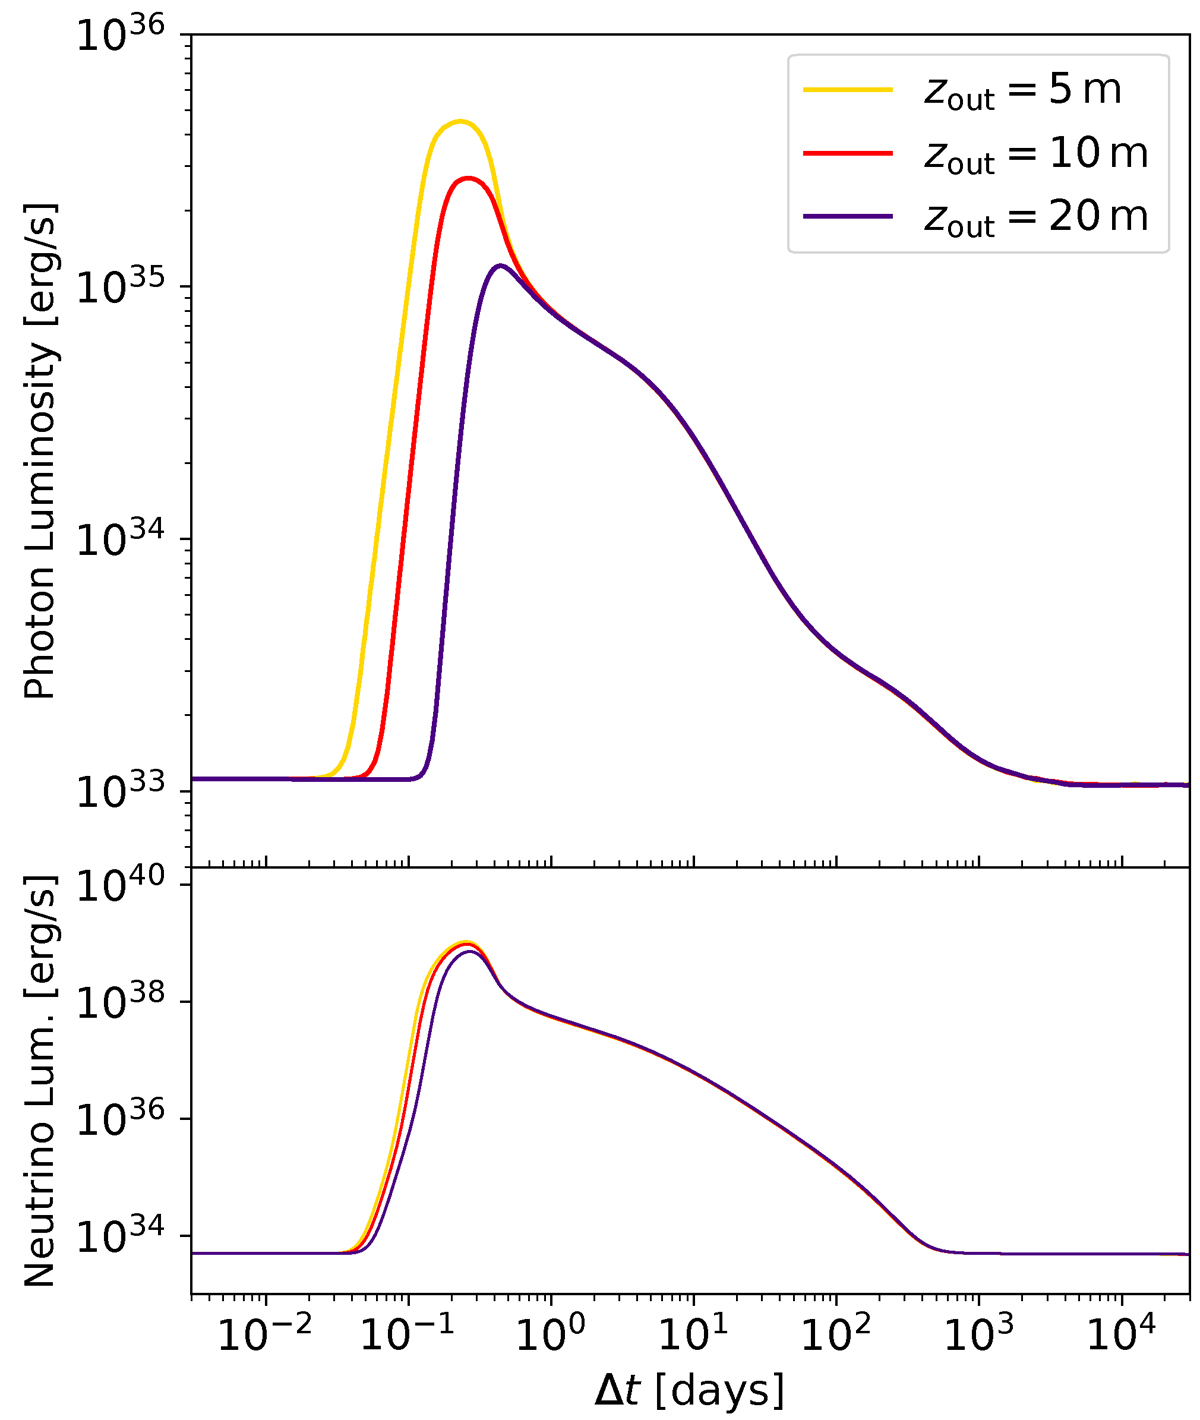
Fig. 4.
Download original image
Same of Fig. 3, varying the outermost limit of the heated region zout as reported in the caption, keeping all other parameters fixed, for two envelope models. In this case, the separate contributions are not shown, as they only show marginal differences.
Current usage metrics show cumulative count of Article Views (full-text article views including HTML views, PDF and ePub downloads, according to the available data) and Abstracts Views on Vision4Press platform.
Data correspond to usage on the plateform after 2015. The current usage metrics is available 48-96 hours after online publication and is updated daily on week days.
Initial download of the metrics may take a while.