Fig. 1.
Download original image
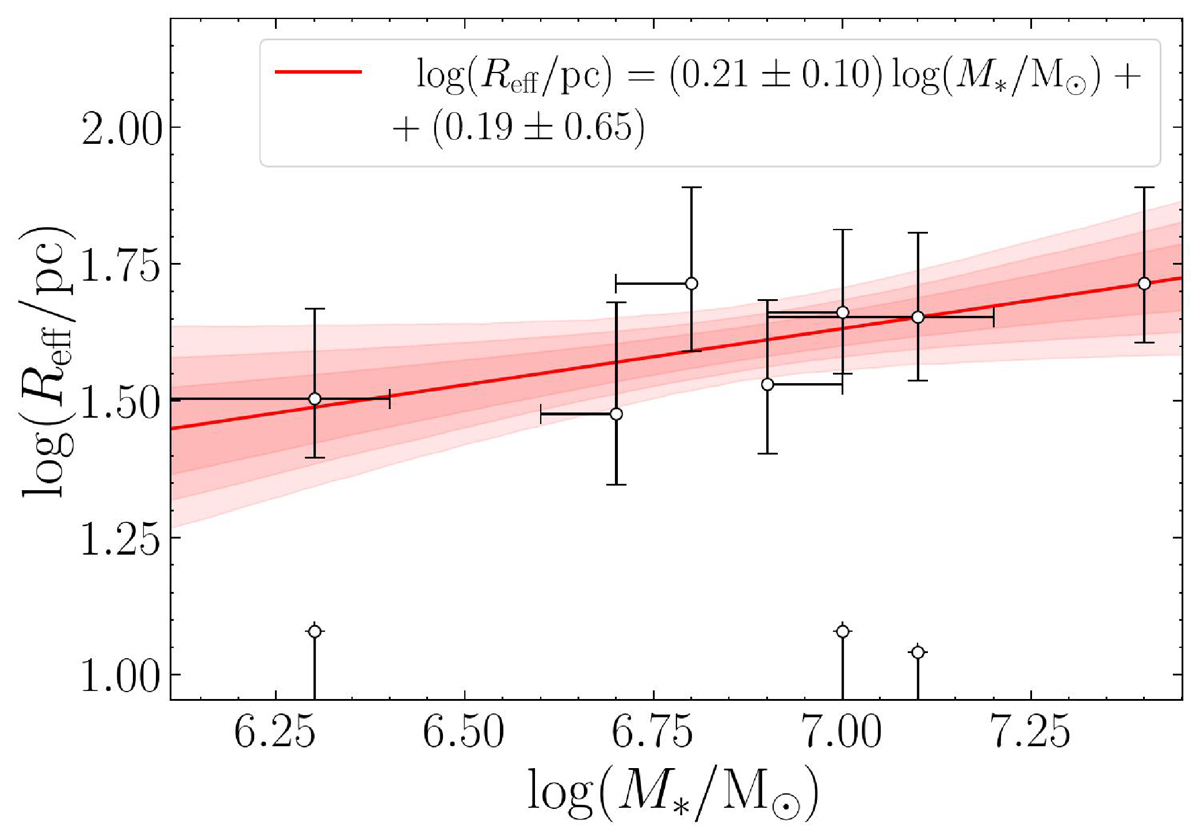
Size-mass relation for the extraplanar clumps of the Sparkler galaxy (Sect. 2). Clumps are shown as black empty circles, while the best-fitting line (obtained as described in Sect. 2.1) is plotted as the red solid line. The red shaded areas (from opaque to transparent red) show the 1σ, 2σ, 3σ intervals of the fit, respectively.
Current usage metrics show cumulative count of Article Views (full-text article views including HTML views, PDF and ePub downloads, according to the available data) and Abstracts Views on Vision4Press platform.
Data correspond to usage on the plateform after 2015. The current usage metrics is available 48-96 hours after online publication and is updated daily on week days.
Initial download of the metrics may take a while.