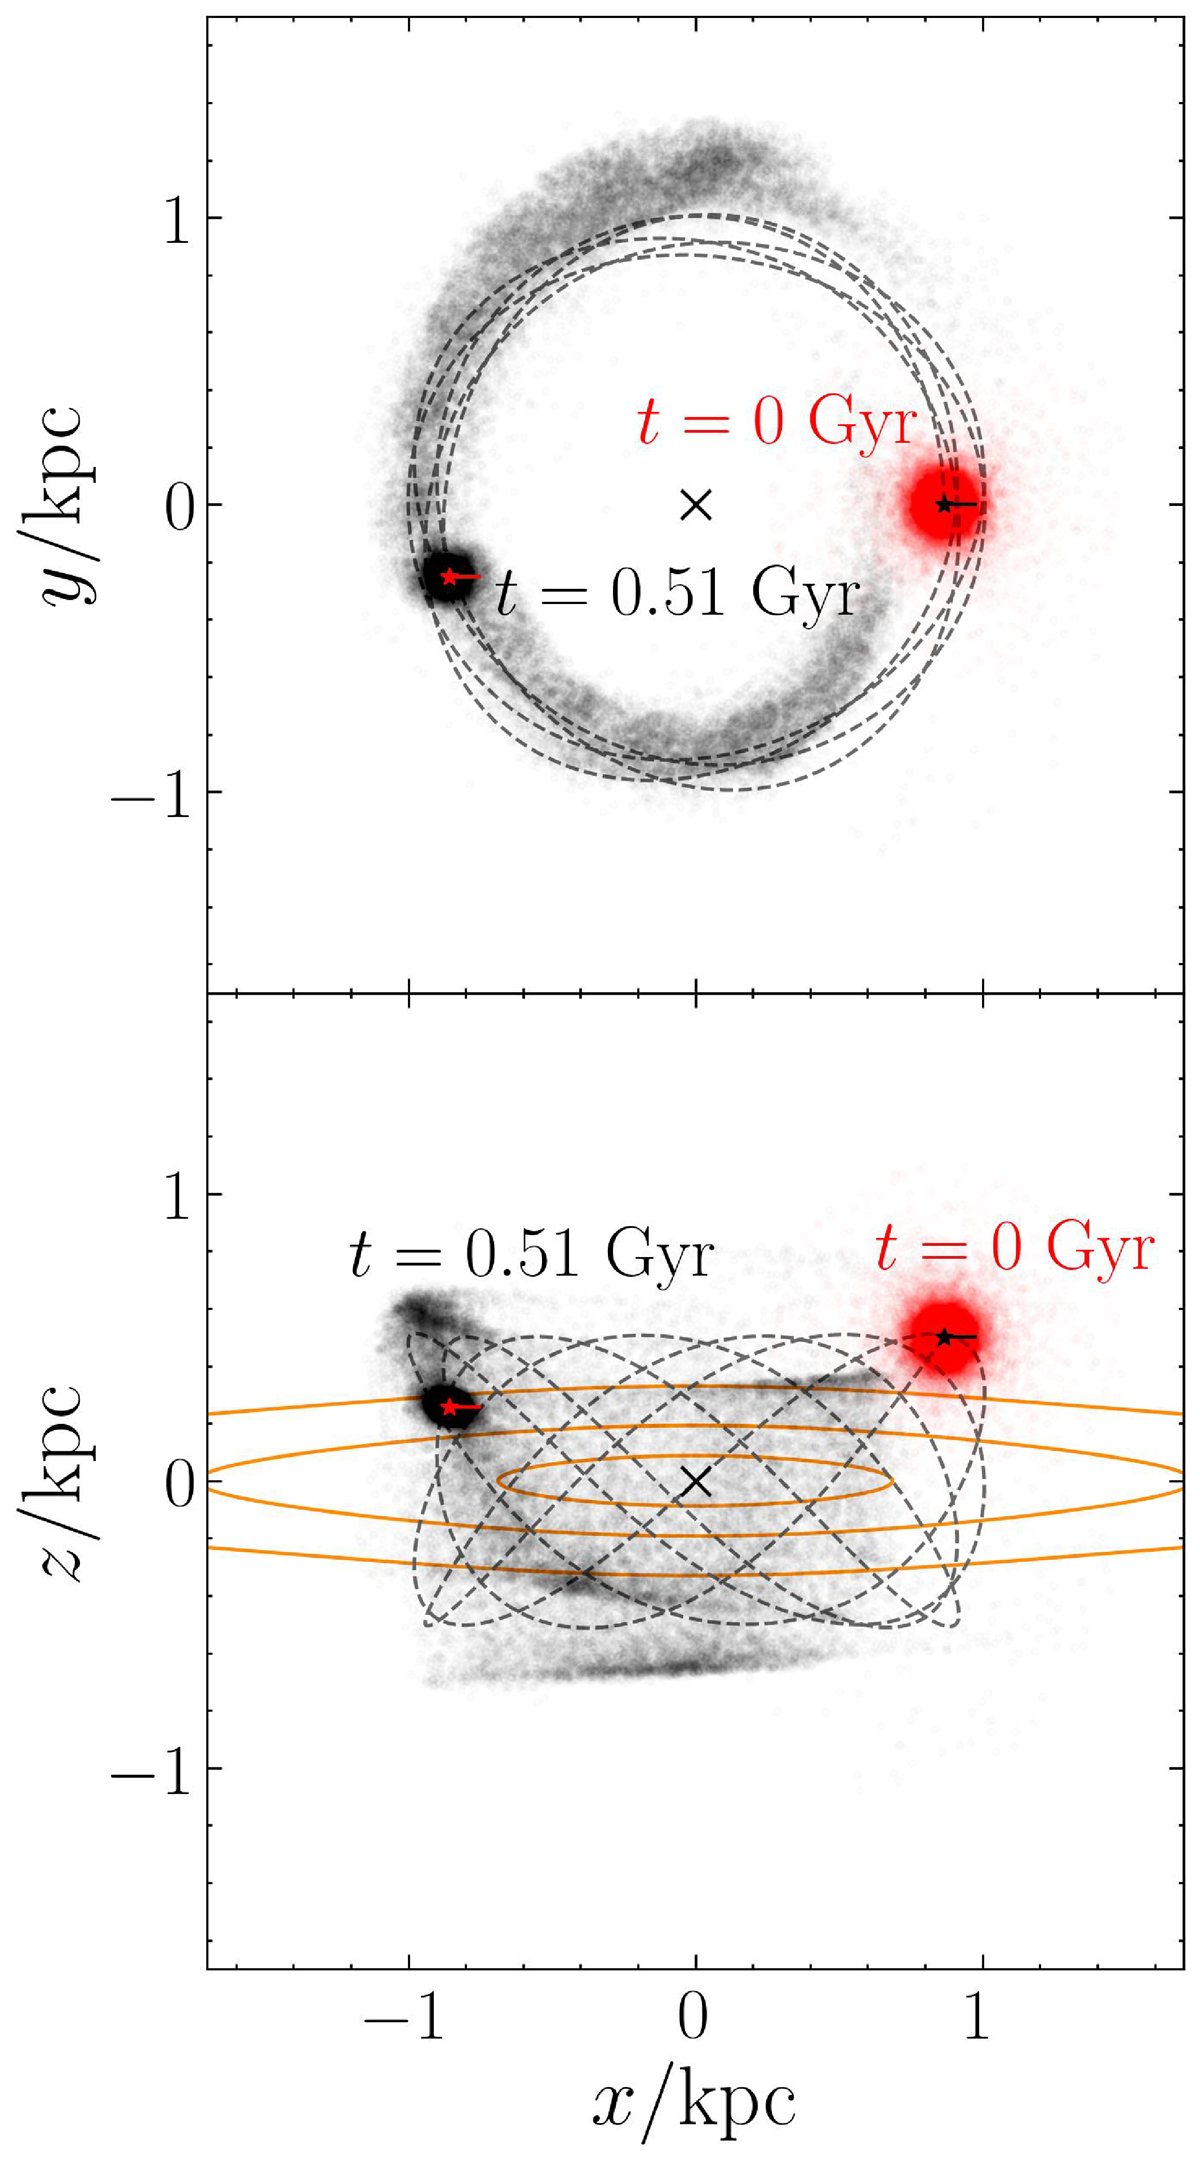
Fig. 11.
Download original image
Comparison between the initial conditions and the snapshot at 0.51 Gyr for the tidal-shock simulation described in Sect. 5.2 in the case of mass M* = 106 M⊙. The top and bottom panels show the projections on the x − y and x − z planes, respectively. The clump stellar particles are shown as red and black dots for the snapshots at t = 0 Gyr and t = 0.51 Gyr, respectively. The centres of clumps at t = 0 Gyr and t = 0.51 Gyr are shown as a black and red star, respectively, with an horizontal line of length 4 rs, i, where rs, i is the initial Plummer scale radius. The grey dashed curves represent the trajectory of the clump. The orange curves trace iso-density contours of the Sparkler disc external potential. The centre of the system is marked by a black cross.
Current usage metrics show cumulative count of Article Views (full-text article views including HTML views, PDF and ePub downloads, according to the available data) and Abstracts Views on Vision4Press platform.
Data correspond to usage on the plateform after 2015. The current usage metrics is available 48-96 hours after online publication and is updated daily on week days.
Initial download of the metrics may take a while.