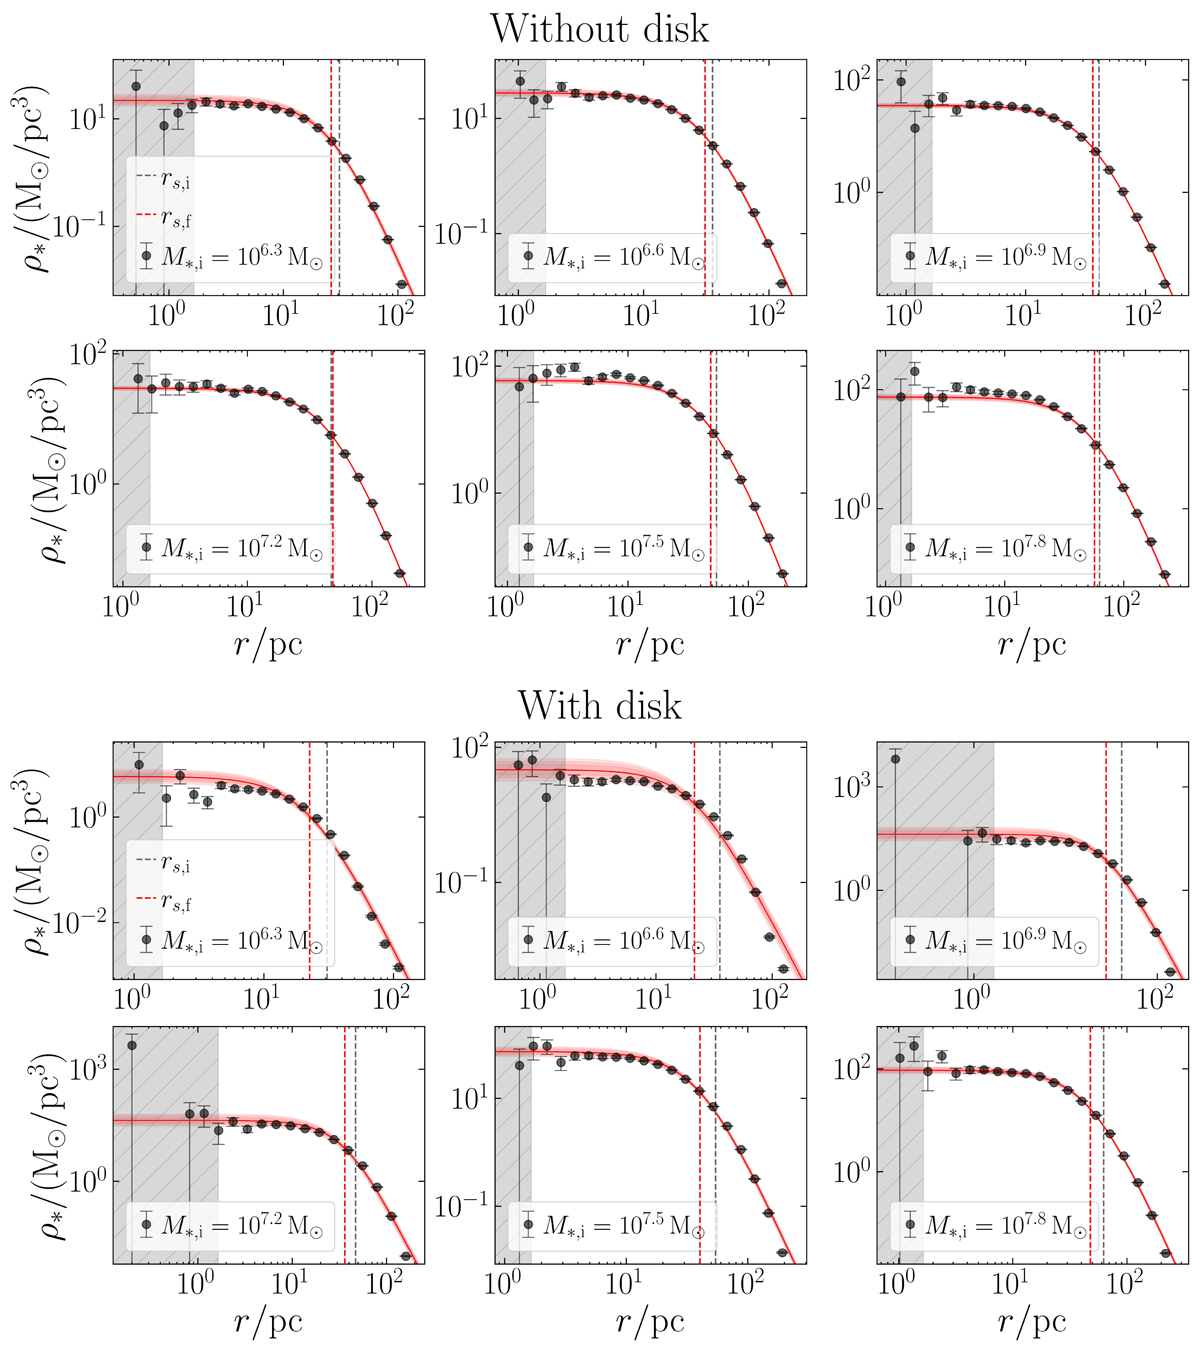
Fig. A.1.
Download original image
Final 3D density profiles of the clumps in the spherical-host simulations presented in Sect. 5.1 (first two rows) and for the case in which the external potential also includes a Sparkler-like stellar disc as described in Sect. 5.2 (last two rows). First and third row: Clumps with mass 106.3 M⊙, 106.6 M⊙, and 106.9 M⊙ (left, central, and right panels, respectively). Second and fourth row: Clumps with mass 107.2 M⊙, 107.5 M⊙, and 107.8 M⊙ (left, central, and right panels, respectively). The black dots are the N-body density profiles, while the red solid line is the best-fit Plummer density profile (with the shaded are marking the 1σ, 2σ, and 3σ confidence levels), as described in Appendix A. The grey shaded area highlights the region within the softening length, that is excluded from the fit. The grey dashed line is the initial Plummer scale radius rs, i, and the red dashed line is the best-fit final scale radius rs, f.
Current usage metrics show cumulative count of Article Views (full-text article views including HTML views, PDF and ePub downloads, according to the available data) and Abstracts Views on Vision4Press platform.
Data correspond to usage on the plateform after 2015. The current usage metrics is available 48-96 hours after online publication and is updated daily on week days.
Initial download of the metrics may take a while.