Fig. 2.
Download original image
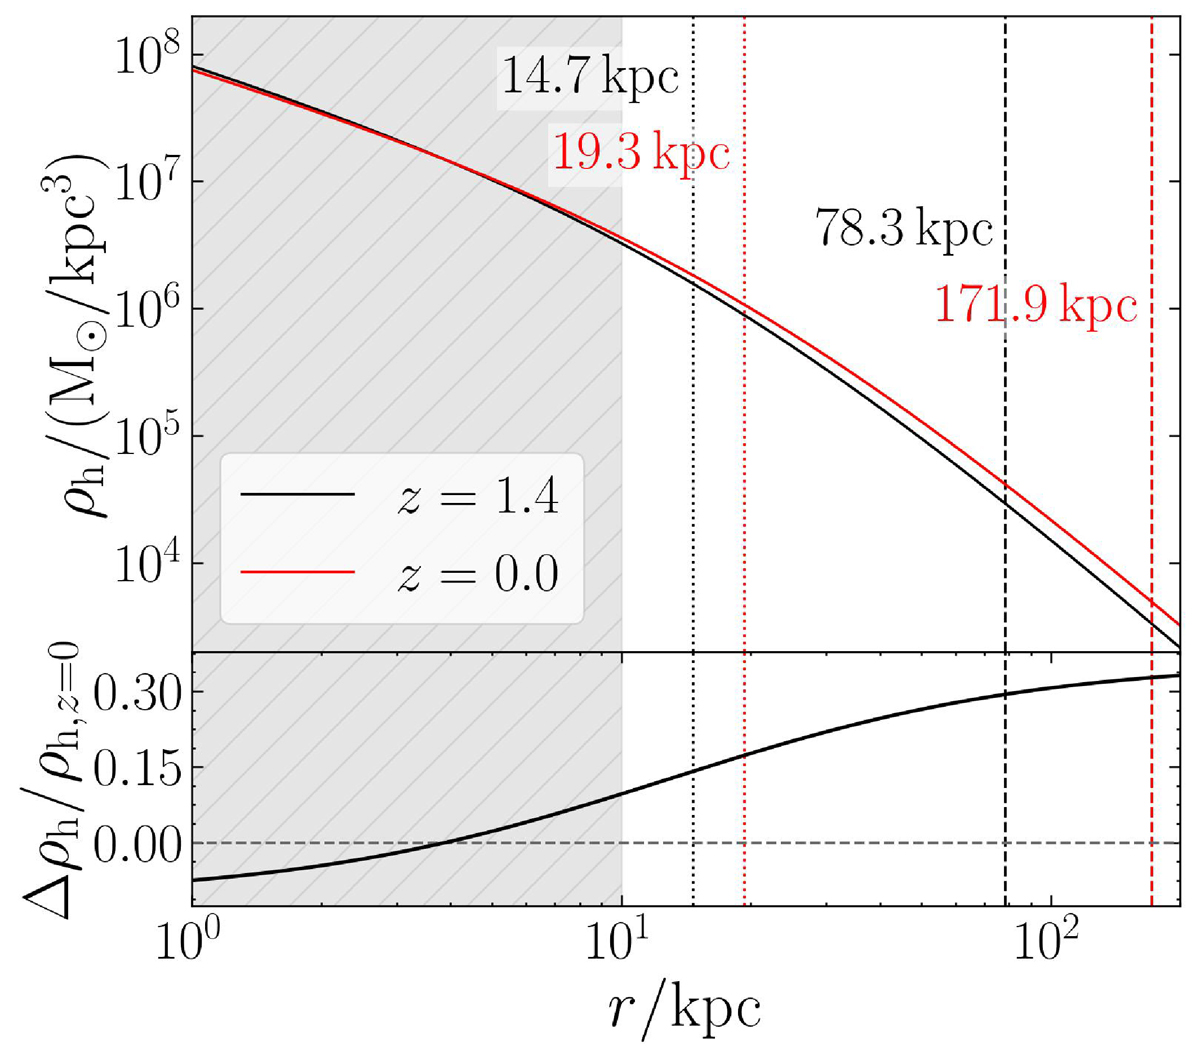
Top panel: Density profile of the highest-mass DM halo of the Sparkler galaxy as predicted by the models by Correa et al. (2015). Black lines indicate the z = 0 profile while red lines the z = 1.378 one. The dotted lines mark r−2, the dashed lines mark r200. The grey shaded area marks the region between 1 and 10 kpc, that is the interval under study. Bottom panel: Difference between the halo density profile at z = 0 and at z = 1.378 normalised to the density profile at z = 0.
Current usage metrics show cumulative count of Article Views (full-text article views including HTML views, PDF and ePub downloads, according to the available data) and Abstracts Views on Vision4Press platform.
Data correspond to usage on the plateform after 2015. The current usage metrics is available 48-96 hours after online publication and is updated daily on week days.
Initial download of the metrics may take a while.