Fig. 3.
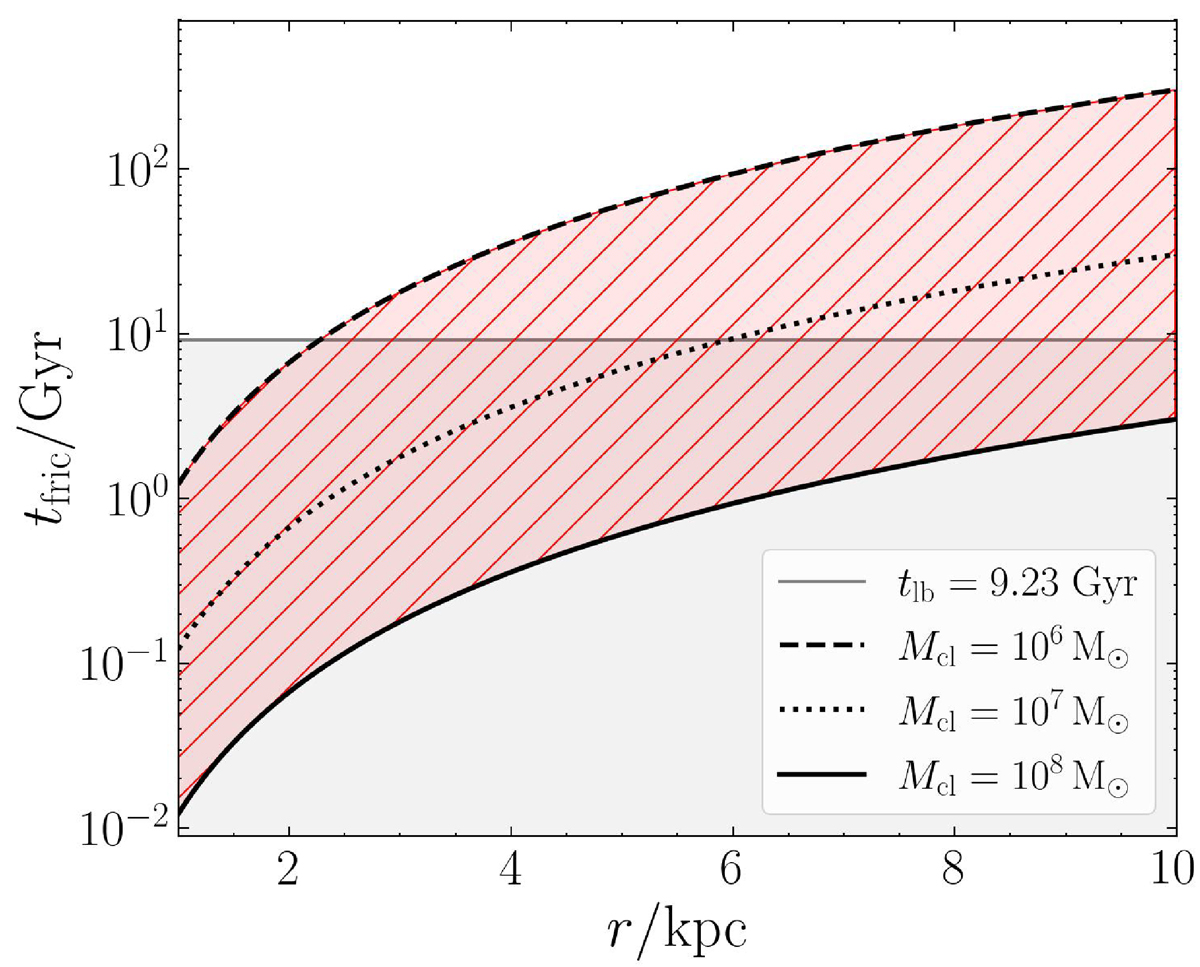
Download original image
Dynamical-friction timescales for clumps of mass 106, 107, and 108 M⊙ (dashed, dotted and solid lines, respectively) as a function of the distance from the centre of the halo. The red-dashed area covers the range of dynamical friction timescales relative to the interval of clump masses and distances of interest. The grey horizontal line corresponds to the look-back time at z ≈ 1.4 tlb = 9.23 Gyr, that divides the plot between the region in which the dynamical friction is most likely inefficient (tfric > 9.23 Gyr) and efficient (tfric < 9.23 Gyr). The latter is marked by the grey area.
Current usage metrics show cumulative count of Article Views (full-text article views including HTML views, PDF and ePub downloads, according to the available data) and Abstracts Views on Vision4Press platform.
Data correspond to usage on the plateform after 2015. The current usage metrics is available 48-96 hours after online publication and is updated daily on week days.
Initial download of the metrics may take a while.