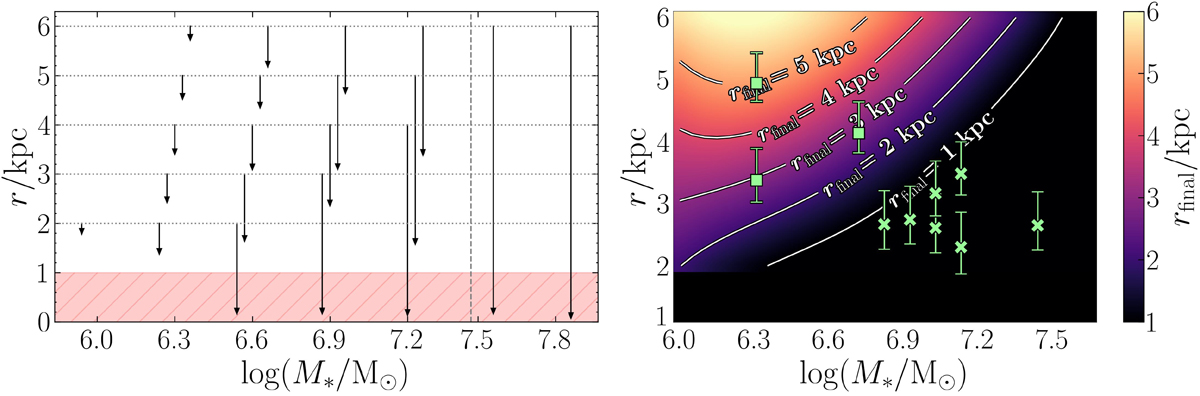
Fig. 4.
Download original image
Left panel: Evolution over 9.23 Gyr of the distances from the centre of the point-mass clumps orbiting in a Sparkler-like potential with circular orbit initial conditions. On the x-axis, the mass of the clump is reported, and the black arrows point from the initial to the final distance. The final distance is computed as the average distance from the centre of the system, within the last 5% of the simulated time. The masses larger than the vertical dotted grey line are also larger than the observed stellar masses of the Sparkler clumps. We classify as survived the clumps with final distance out of the shaded area. Right panel: Colour map of the final distance of the clumps as a function of their initial distance (y-axis) and dynamical mass (x-axis), obtained by interpolating the simulations shown in the left panel. The colour bar traces the final distance and goes from 1 kpc (or less) to 6 kpc (the largest simulated initial distance). The contours mark the combinations of initial distance and mass that result in specific values of final distance (from 1 to 5 kpc). The green data points are the extraplanar Sparkler clumps (Claeyssens et al. 2023; Forbes & Romanowsky 2023). For each clump three distances are computed, de-projecting the observed distances depending on the three spatial configurations studied in Sect. 2.4 (face-on disc, edge-on disc, and spherical), as described in Sect. 4.2. The symbols (squares and crosses) indicate the median of the three possible distances, with the error-bars corresponding to the minimum and maximum distance. We used squares for the clumps that survive, while we used crosses for the clumps for which the inferred final distance is smaller than 1 kpc.
Current usage metrics show cumulative count of Article Views (full-text article views including HTML views, PDF and ePub downloads, according to the available data) and Abstracts Views on Vision4Press platform.
Data correspond to usage on the plateform after 2015. The current usage metrics is available 48-96 hours after online publication and is updated daily on week days.
Initial download of the metrics may take a while.