Fig. 5.
Download original image
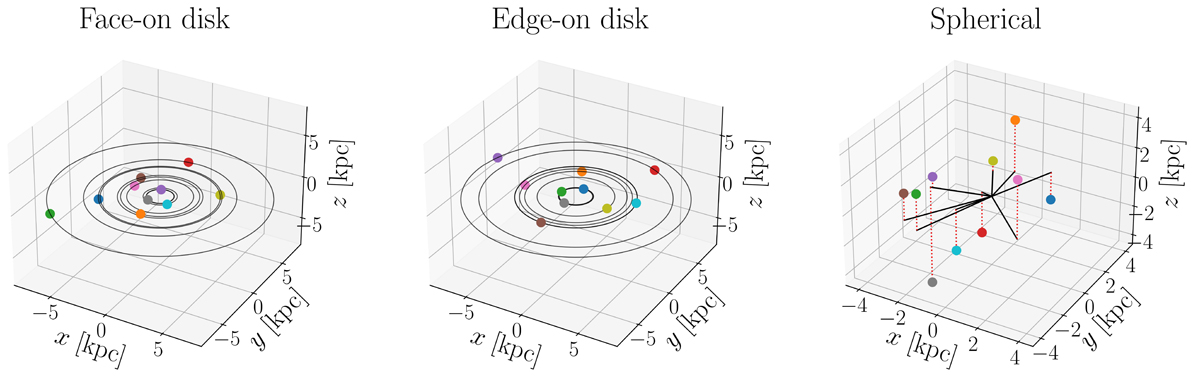
Initial spatial distribution of the ten clumps in representative simulations of the three different spatial configurations described in Sect. 2.4. The initial positions of the clumps are determined as described in Sect. 4.3. From left to right: Face-on disc, Edge-on disc, and Spherical configurations. Each clump is displayed as a coloured dot. In the first two panels, we plot in grey the trajectory of the circular orbit at which each clump is initialised. This also makes apparent that the orbits of the clumps are co-planar in these two configurations. In the right panel, for each clump we plot the projected distance on the x − y plane as the black solid line, and the z coordinate of the clump as the red dotted line, to show that the clumps are not co-planar.
Current usage metrics show cumulative count of Article Views (full-text article views including HTML views, PDF and ePub downloads, according to the available data) and Abstracts Views on Vision4Press platform.
Data correspond to usage on the plateform after 2015. The current usage metrics is available 48-96 hours after online publication and is updated daily on week days.
Initial download of the metrics may take a while.