Fig. 6.
Download original image
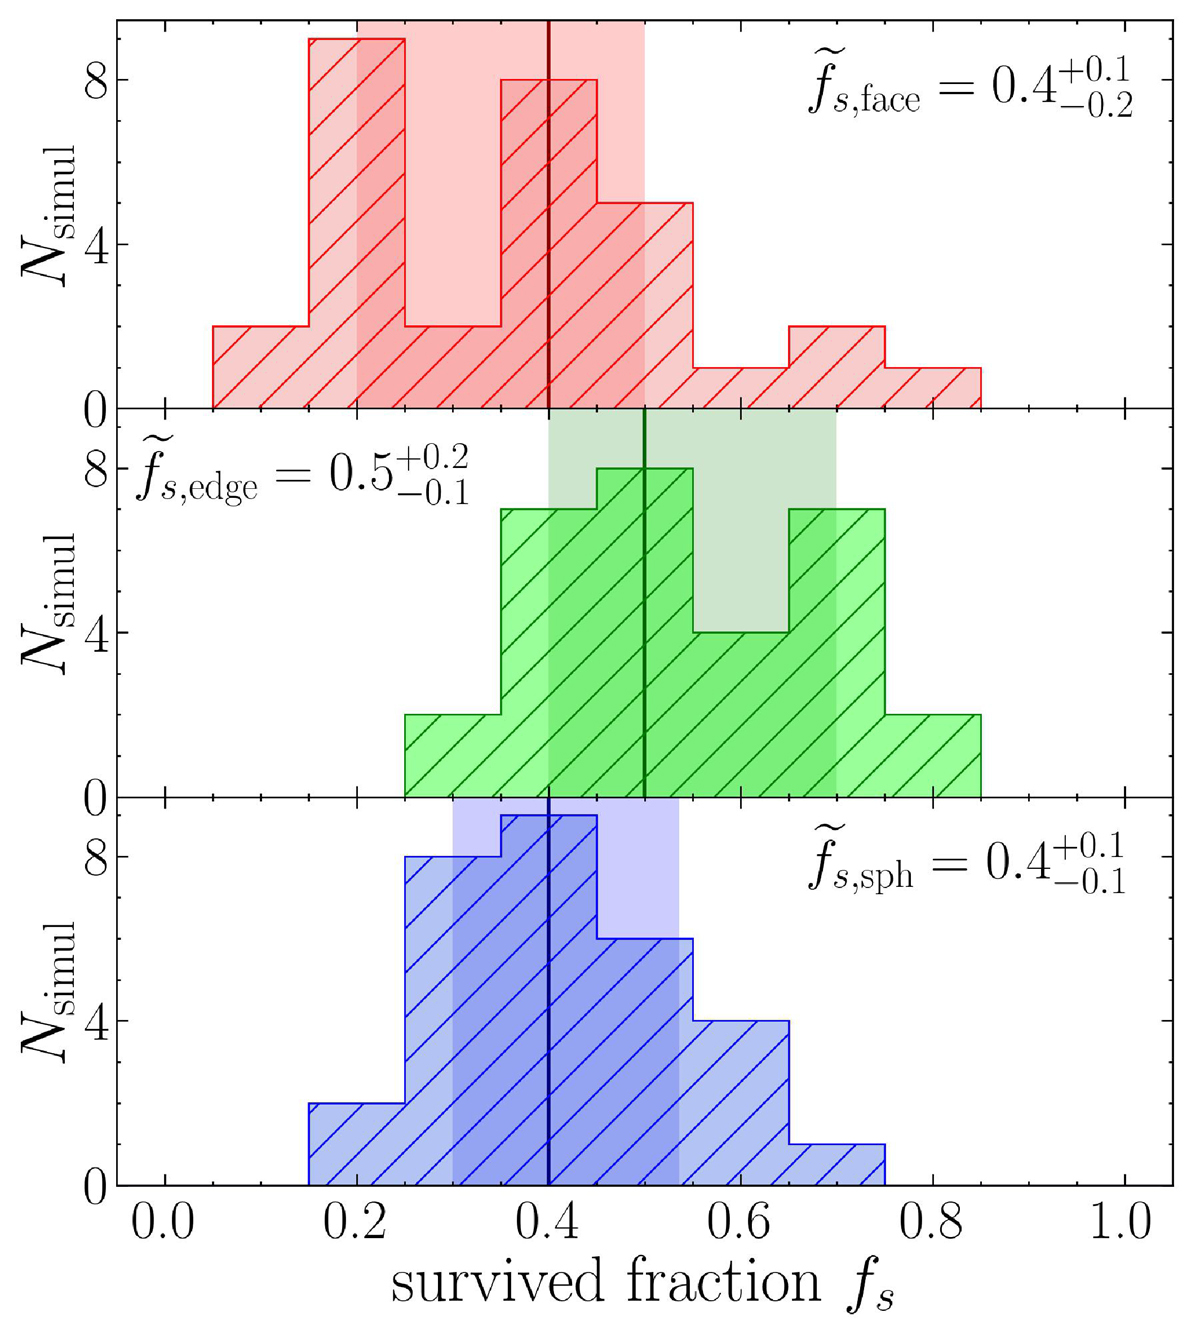
Fraction of survived clumps of each of the 30 simulations run in the face-on (top panel, in red), edge-on (middle panel, in green) and spherical (bottom panel, in blue) configurations. A clump is flagged as survived if its distance from the centre of the halo at the end of the simulation is larger than 1 kpc. The vertical solid line and the shaded area show the median fraction of survived clumps ![]() and the 1σ interval, respectively (also reported in the legend).
and the 1σ interval, respectively (also reported in the legend).
Current usage metrics show cumulative count of Article Views (full-text article views including HTML views, PDF and ePub downloads, according to the available data) and Abstracts Views on Vision4Press platform.
Data correspond to usage on the plateform after 2015. The current usage metrics is available 48-96 hours after online publication and is updated daily on week days.
Initial download of the metrics may take a while.