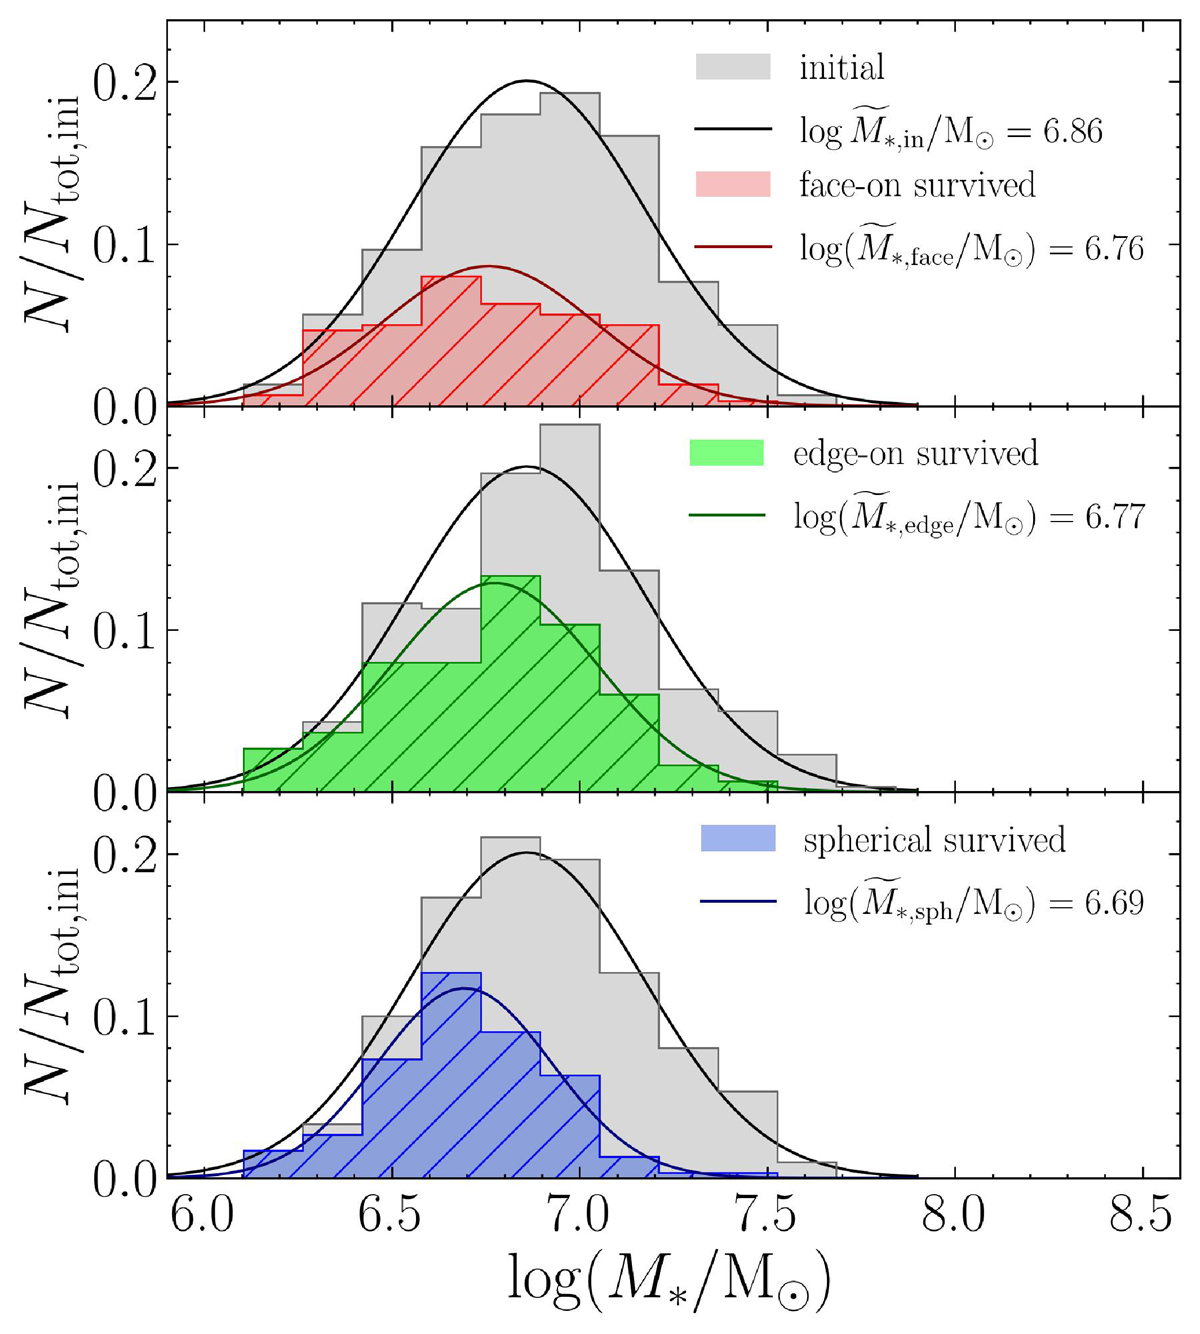
Fig. 7.
Download original image
Fraction of initial clumps and survived clumps per mass-bin, shown as grey histograms and coloured histograms (red for the face-on configuration, green for the edge-on configuration and blue for the spherical configuration), respectively. We show the face-on configuration in the top panel, the edge-on configuration in the middle panel, the spherical configuration in the bottom panel. The histograms are built binning all the clumps (either initial or survived) of the 30 simulations, normalised to the initial total number of clumps (ten for each simulation, therefore 300). The black and coloured lines are the best-fitting Gaussian distributions, of which we report the mean in the legend.
Current usage metrics show cumulative count of Article Views (full-text article views including HTML views, PDF and ePub downloads, according to the available data) and Abstracts Views on Vision4Press platform.
Data correspond to usage on the plateform after 2015. The current usage metrics is available 48-96 hours after online publication and is updated daily on week days.
Initial download of the metrics may take a while.