Fig. 8.
Download original image
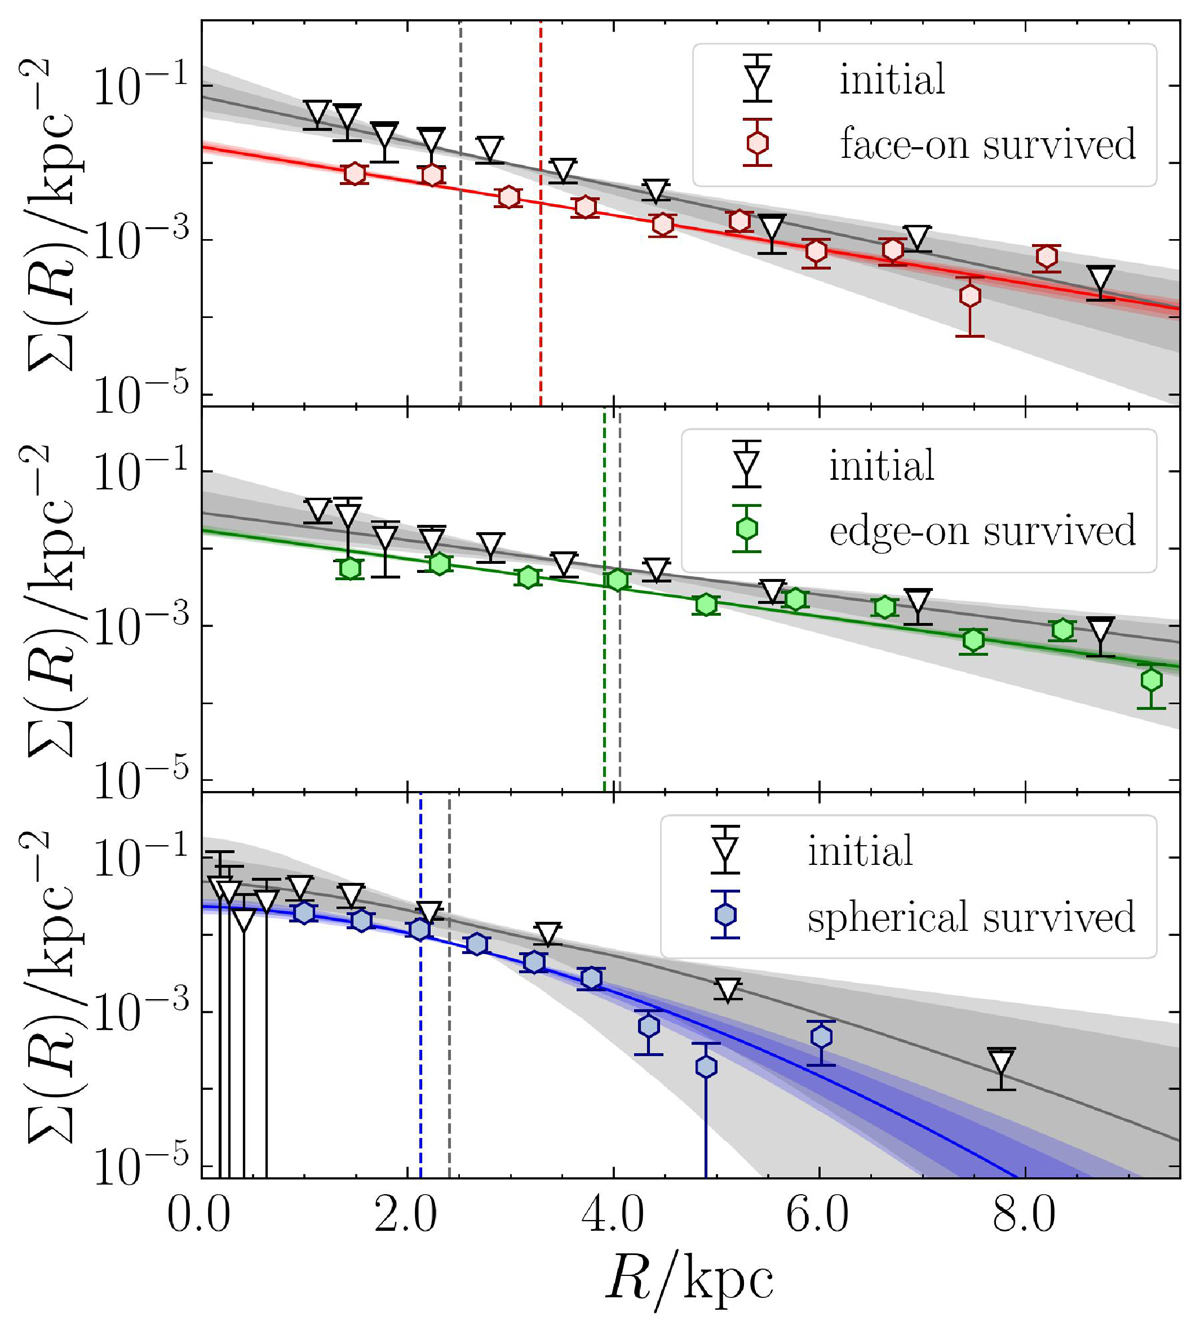
Surface number density profiles of the clumps in the face-on (top panel), edge-on (middle panel), and spherical configuration (bottom panel). In each panel, the dark grey line is the initial distribution, with the grey shaded areas covering the 1σ and 2σ intervals, built adopting the corresponding function described in Sect. 2.4 with the best-fit parameters listed in the first row of Table 3. We projected all the profiles along the z axis. The triangles show the profiles of the initial clump positions in the x − y plane, computed stacking together the 10 clumps in all the 30 runs. The coloured hexagons show the surface number density profiles at the end of the simulations, obtained stacking together all the survived clumps. The corresponding coloured solid line is the best-fit profile to the final projected distances of the survived clumps, obtained as described in Sect. 4.4. We normalised all the profiles to the total number of initial clumps, so the integral of the initial profiles is equal to 1, and the integral of the survived profiles is equal to the average surviving fraction (distributions shown in Fig. 6).
Current usage metrics show cumulative count of Article Views (full-text article views including HTML views, PDF and ePub downloads, according to the available data) and Abstracts Views on Vision4Press platform.
Data correspond to usage on the plateform after 2015. The current usage metrics is available 48-96 hours after online publication and is updated daily on week days.
Initial download of the metrics may take a while.