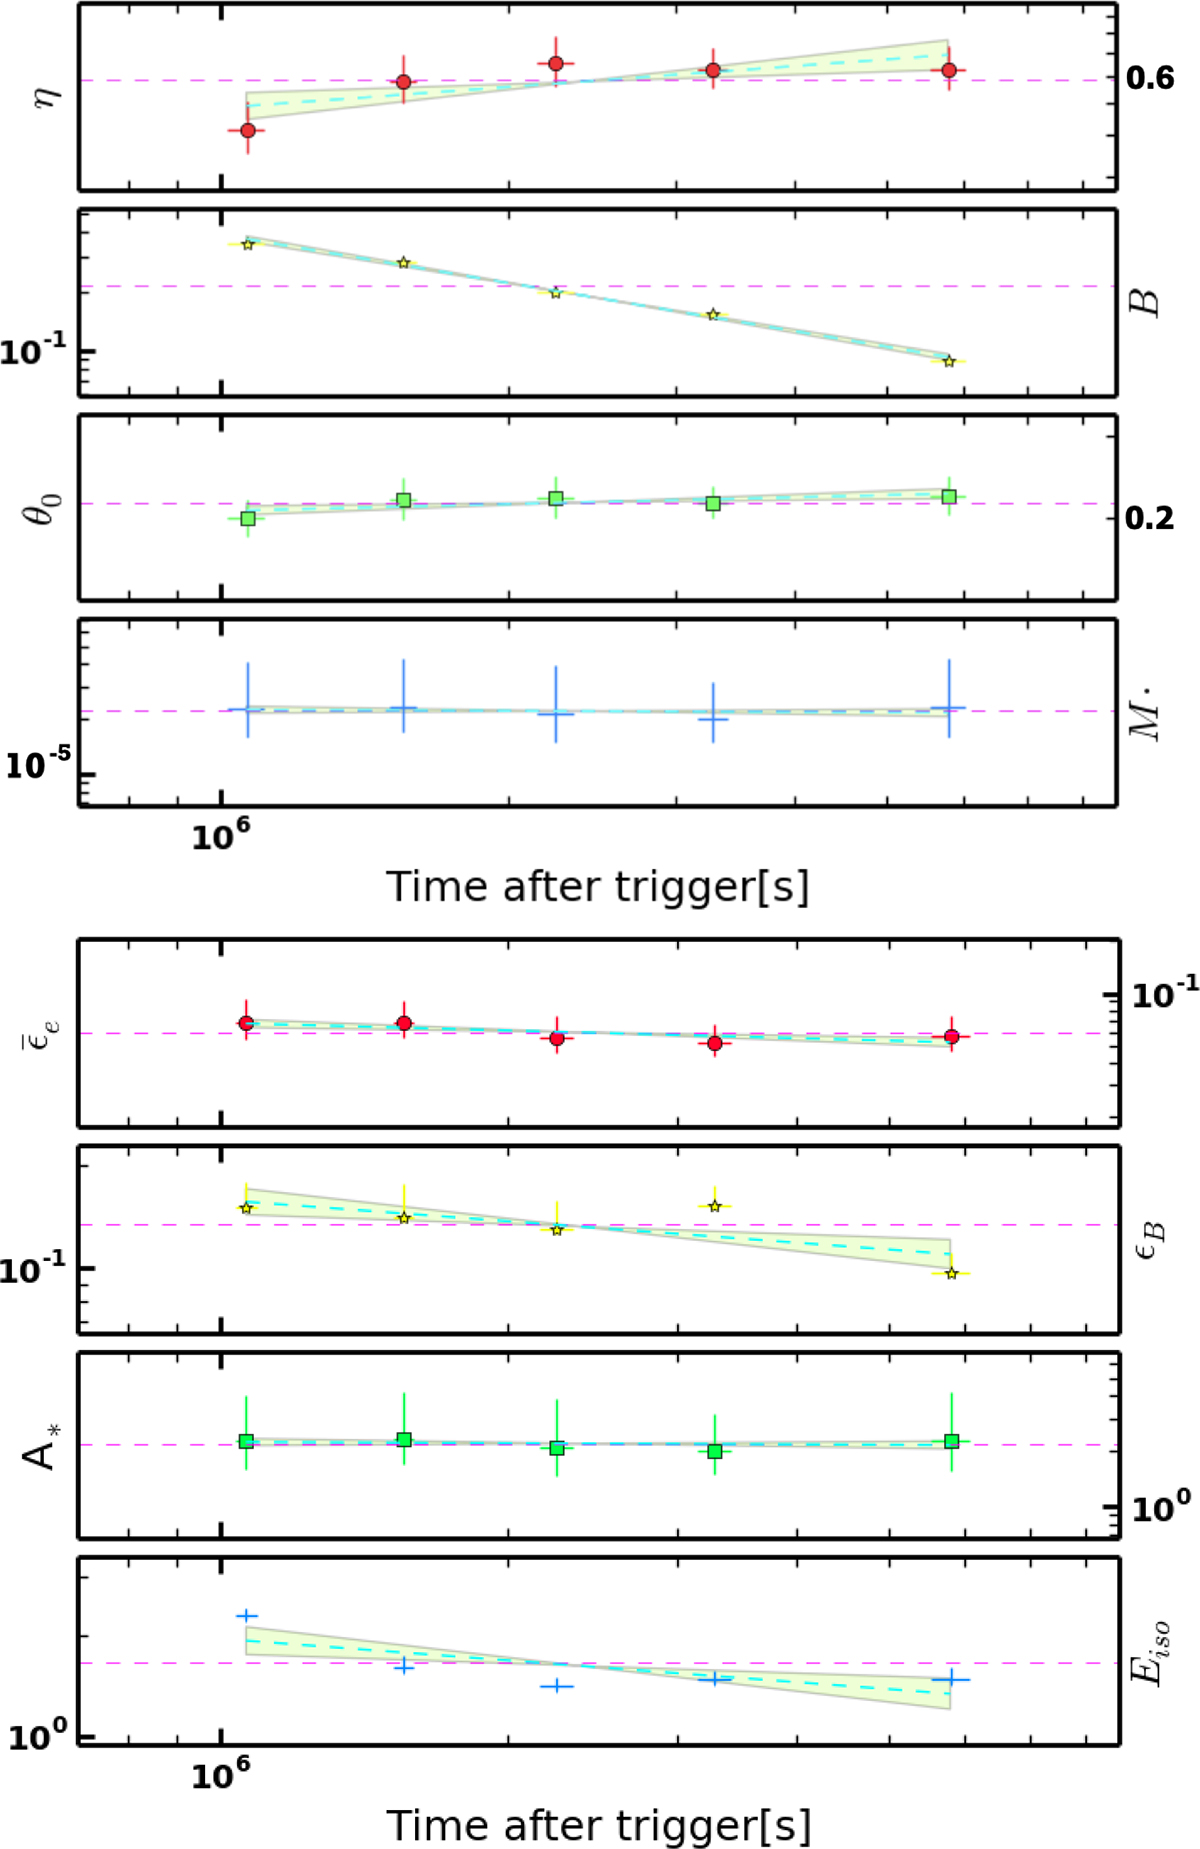
Fig. 16.
Download original image
Slow cooling: Evolution of the derived dynamical (top) and microphysical (bottom) parameters of the afterglow of GRB 100418A without SSC emission. The blue dashed lines and shaded regions represent the results from the fit of the observed temporal evolution. The horizontal dashed purple lines show the average value for each parameter. EK, iso is in units of 1052 erg.
Current usage metrics show cumulative count of Article Views (full-text article views including HTML views, PDF and ePub downloads, according to the available data) and Abstracts Views on Vision4Press platform.
Data correspond to usage on the plateform after 2015. The current usage metrics is available 48-96 hours after online publication and is updated daily on week days.
Initial download of the metrics may take a while.