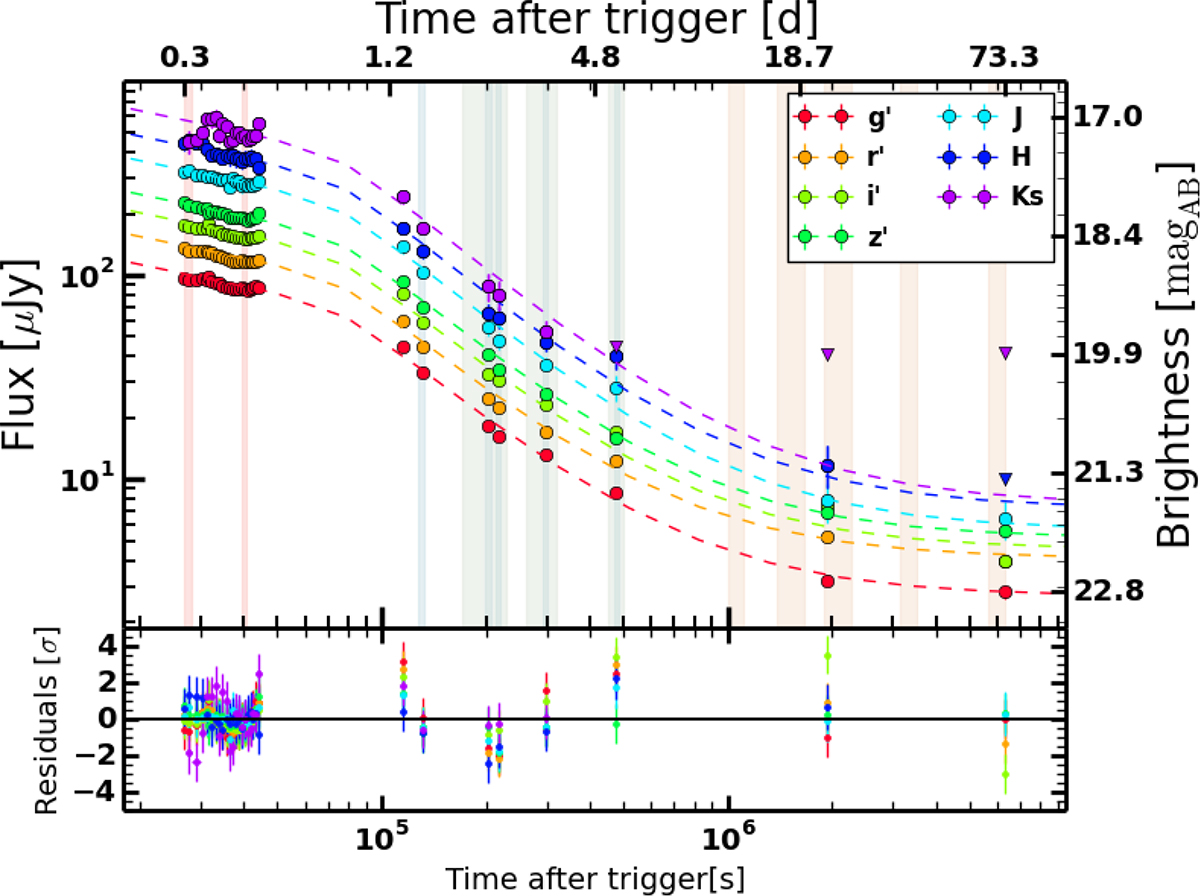
Fig. 2.
Download original image
GROND light curve g′r′i′z′JHKs of the afterglow of GRB 100418A. The best fit of the combined optical/NIR and X-ray data is a smooth broken power-law with host contribution shown in dash lines. The epochs used for the spectral analysis are highlighted with the vertical bars. The first two epochs highlighted in light red correspond to the energy injection phase. The last five epochs in orange correspond to the slow cooling regime, the earlier epochs to fast cooling (see Sect. 3.3.1). For the blue epochs joint GROND-XRT SEDs were produced (see Fig. 4 and Sect. 3.2.1). The green and orange epochs correspond to the SED analysis that includes radio data (Sect. 3.3).
Current usage metrics show cumulative count of Article Views (full-text article views including HTML views, PDF and ePub downloads, according to the available data) and Abstracts Views on Vision4Press platform.
Data correspond to usage on the plateform after 2015. The current usage metrics is available 48-96 hours after online publication and is updated daily on week days.
Initial download of the metrics may take a while.