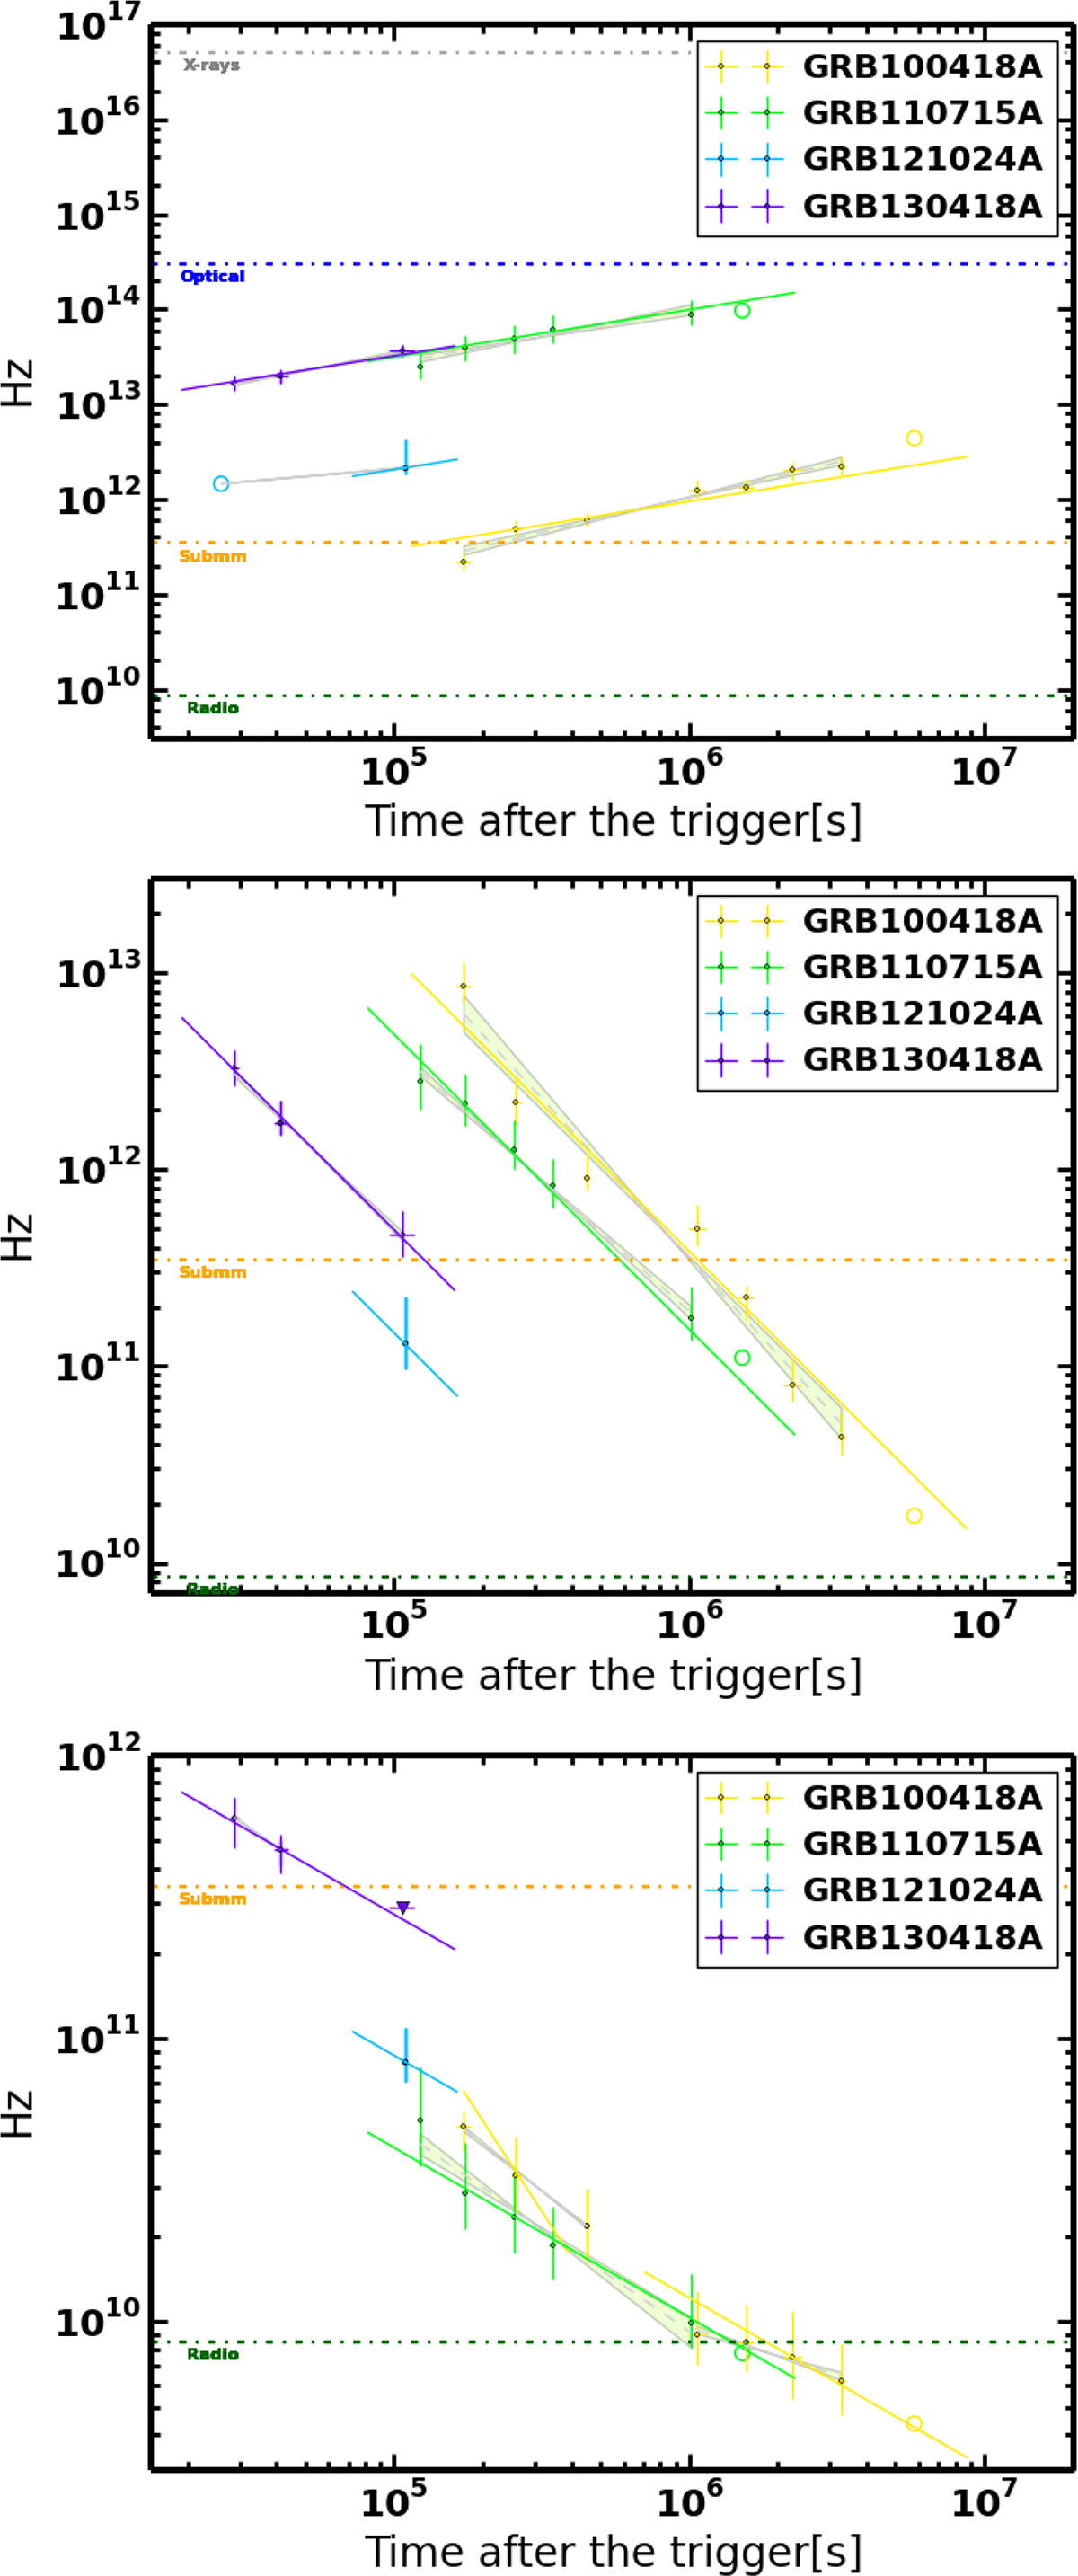
Fig. 20.
Download original image
Evolution of the break frequencies, νc (top), νm (middle) and νsa (bottom), for the afterglows of our four GRBs. The solid lines corresponds to the expected evolution of each frequency from the standard afterglow theory. The shaded regions are the fits for each break frequency. The horizontal dashed lines mark the mid-frequency for the four main observing ranges, i.e., X-rays, optical, sub-millimetre and radio.
Current usage metrics show cumulative count of Article Views (full-text article views including HTML views, PDF and ePub downloads, according to the available data) and Abstracts Views on Vision4Press platform.
Data correspond to usage on the plateform after 2015. The current usage metrics is available 48-96 hours after online publication and is updated daily on week days.
Initial download of the metrics may take a while.