Open Access
Fig. 21.
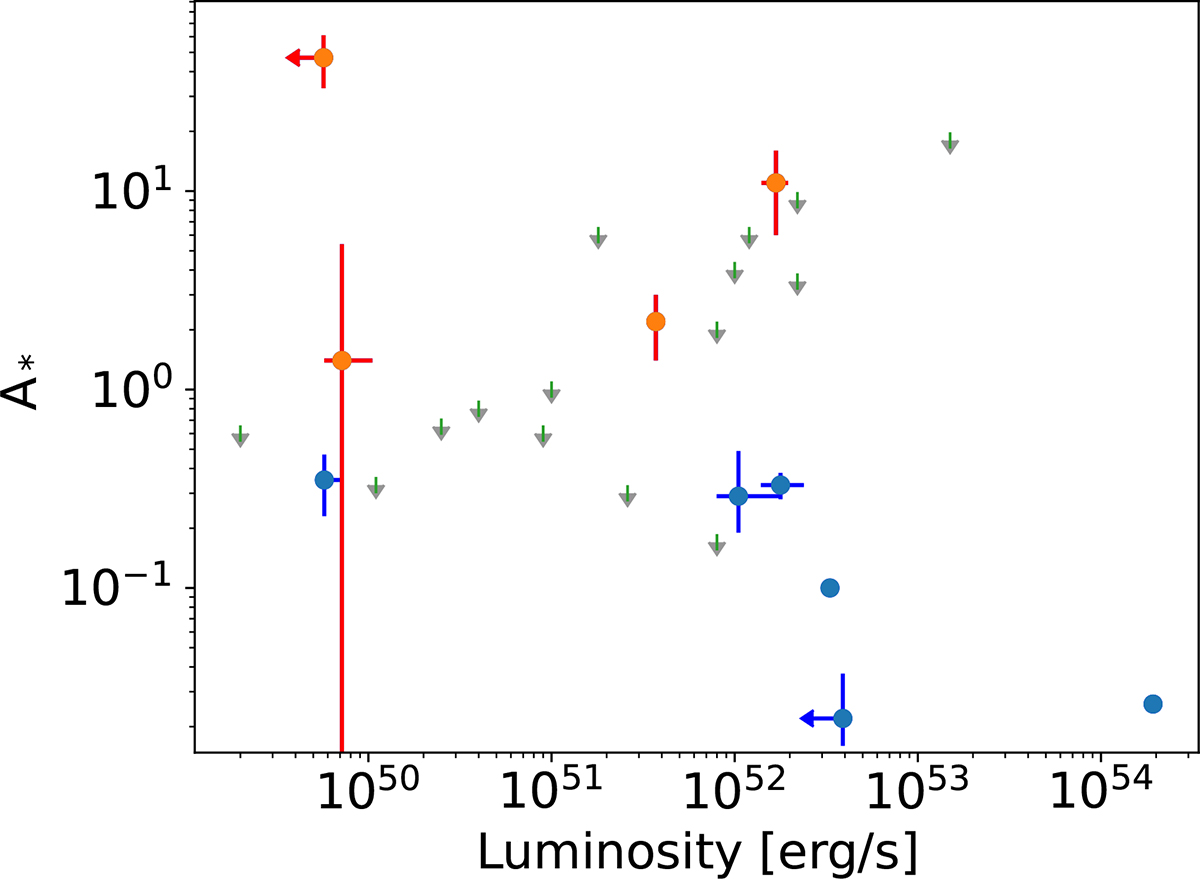
Download original image
Relation between wind density A* and the explosion luminosity (see Table C.1). Literature values are in blue, and our four GRB afterglows are in red. The grey arrows are limits as derived by Hascoët et al. (2014) for a GRB afterglow sample, with limits on the variability timescale and Lorentz factor.
Current usage metrics show cumulative count of Article Views (full-text article views including HTML views, PDF and ePub downloads, according to the available data) and Abstracts Views on Vision4Press platform.
Data correspond to usage on the plateform after 2015. The current usage metrics is available 48-96 hours after online publication and is updated daily on week days.
Initial download of the metrics may take a while.