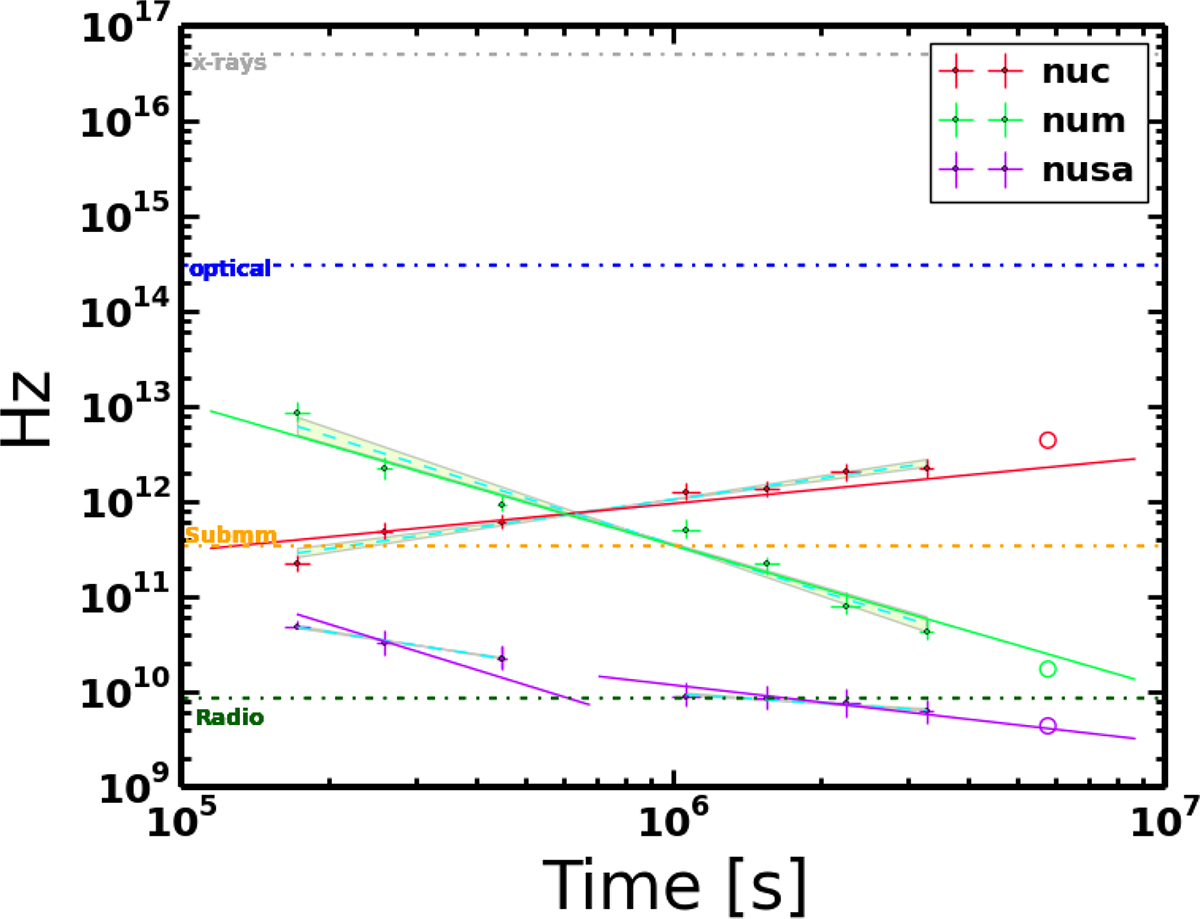
Fig. 6.
Download original image
Evolution of the measured break frequencies for the eight optical to radio SEDs for the GRB 100418A afterglow. The solid lines represent the expected theoretical evolution for a wind environment during fast (< 600 ks) and slow (> 600 ks) cooling. The coloured dashed lines represent the best power-law fits to the measured temporal evolution (open data points were left out from the fit). The horizontal dashed lines show the mean frequencies of our data (X-ray, optical, sub-millimetre, radio).
Current usage metrics show cumulative count of Article Views (full-text article views including HTML views, PDF and ePub downloads, according to the available data) and Abstracts Views on Vision4Press platform.
Data correspond to usage on the plateform after 2015. The current usage metrics is available 48-96 hours after online publication and is updated daily on week days.
Initial download of the metrics may take a while.