Open Access
Fig. 7.
Download original image
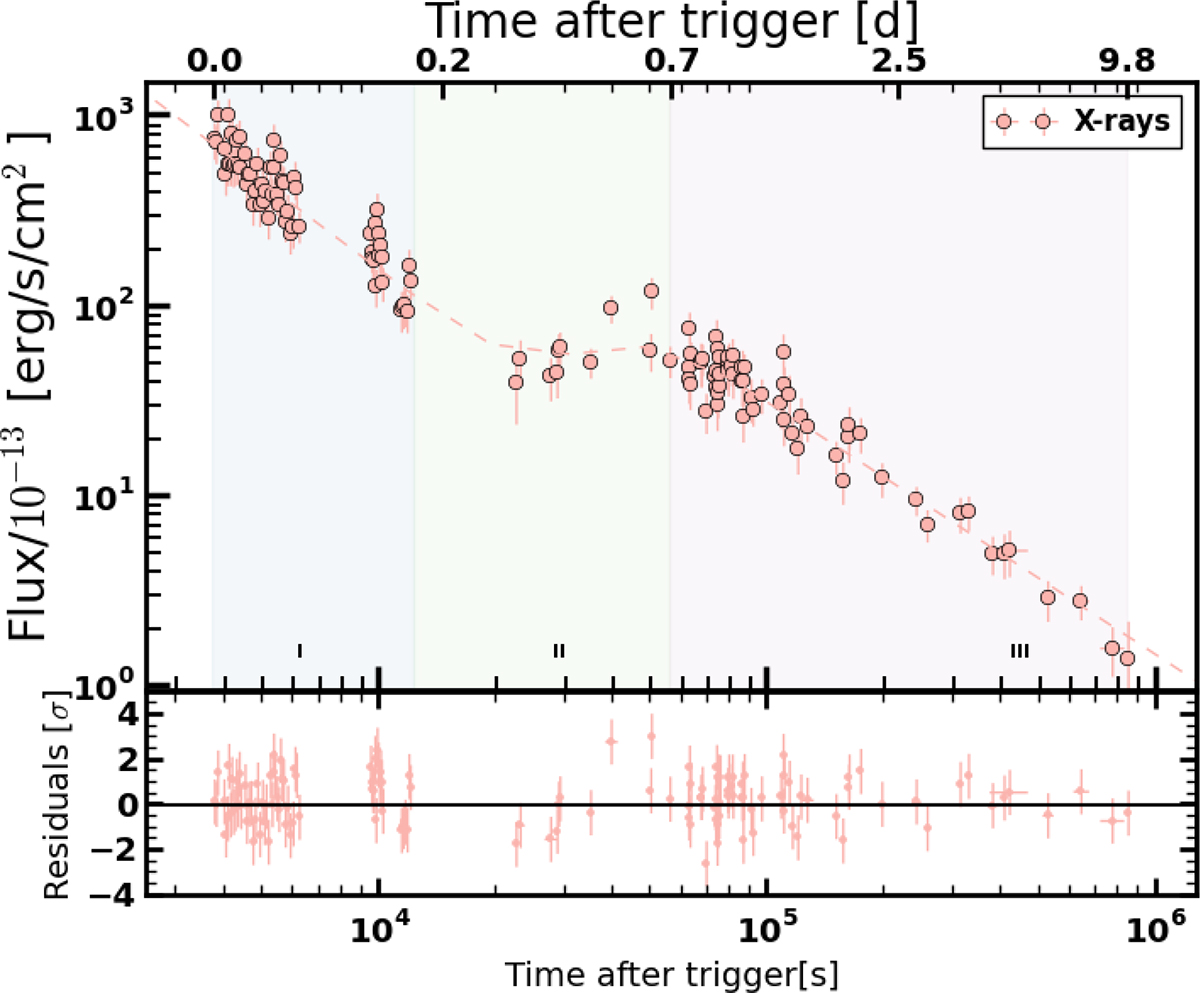
X-ray light curve of the GRB 110715A afterglow described by a smooth double broken power-law shown in dashed lines. The three regions used in the SED analysis are shown as shaded areas, corresponding to the GRB tail, the plateau and the final decay phase, respectively.
Current usage metrics show cumulative count of Article Views (full-text article views including HTML views, PDF and ePub downloads, according to the available data) and Abstracts Views on Vision4Press platform.
Data correspond to usage on the plateform after 2015. The current usage metrics is available 48-96 hours after online publication and is updated daily on week days.
Initial download of the metrics may take a while.