Open Access
Fig. 8.
Download original image
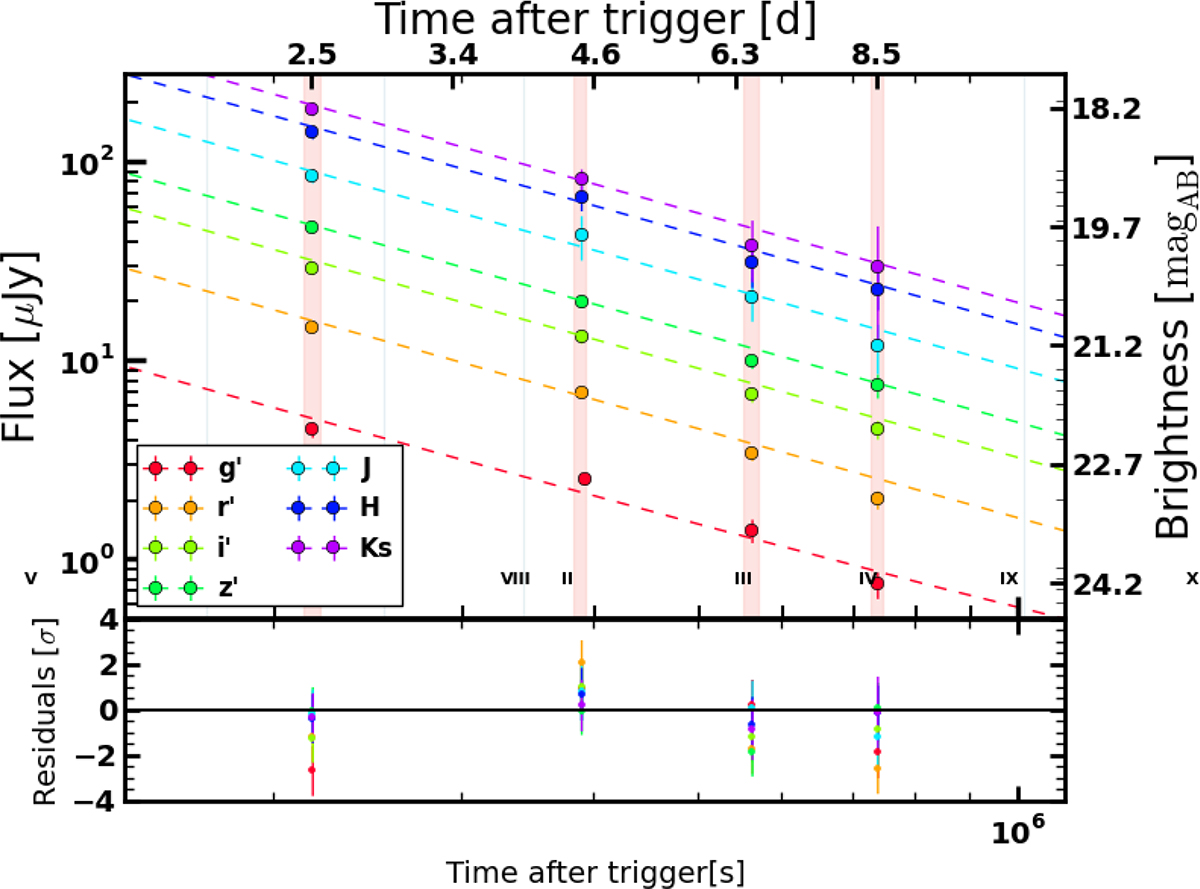
GROND g′r′i′z′JHKs light curve of the GRB 110715A afterglow. The best fit is a single power-law with α = 1.51 ± 0.03, as shown with the dashed lines. The epochs used for the spectral analysis are highlighted with the vertical bars. All four epochs are after the plateau phase.
Current usage metrics show cumulative count of Article Views (full-text article views including HTML views, PDF and ePub downloads, according to the available data) and Abstracts Views on Vision4Press platform.
Data correspond to usage on the plateform after 2015. The current usage metrics is available 48-96 hours after online publication and is updated daily on week days.
Initial download of the metrics may take a while.